Dow Jones Industrial Average finds fresh highs on trade deal hopes, but settles flat
- The Dow Jones surged 650 points on Thursday, climbing to 41,750.
- The Trump administration has announced a preliminary trade deal with the UK.
- The actual details of the trade agreement still leave broad US tariffs on most goods.

The Dow Jones Industrial Average (DJIA) gained ground on Thursday, climbing over 650 points or 1.6% at its peak after the Trump administration announced an incoming (but still not signed) trade deal with the United Kingdom (UK). Under the trade deal, most imports from the UK will still see a 10% tariff across the board, but markets are taking the news as a sign that the Trump administration will continue to at least partially walk back its own tariffs over time. However, the bullish sentiment proved short-lived, with the major equity index falling back to the day's opening bids near 41,370.
Investors are still hoping for a quick resolution to the escalating US-China trade war that has steep 145% import taxes on most goods from China. However, the odds of a quick resolution to tariffs on China remain low. According to President Trump, he has no interest in walking back steep import fees on Chinese goods, and the Chinese administration has been slow to set up trade talks. Delegates from the two countries are slated to have a preliminary meeting to discuss trade details this weekend in Switzerland. Still, policymakers on both sides have been tempering expectations of immediate progress.
Tariff deadline looms ahead, progress on trade deals remains slow
The July 9 deadline for the Trump administration’s self-imposed “pause” on its lopsided “reciprocal tariffs” is fast approaching. Markets still have faith that the Trump administration will be able to ink enough trade deals that the damage from stiff import taxes will be minimized. However, progress has remained slow, and despite President Trump insisting several weeks ago that his administration is in trade negotiations with over 200 countries, progress appears to be non-existent. The UK trade deal announced on Thursday remains unsigned and unofficial, with Donald Trump stating that his administration should have it all “very conclusive” in the coming weeks.
Read more stock news: NASDAQ advances as Trump to announce trade deal with UK
Dow Jones price forecast
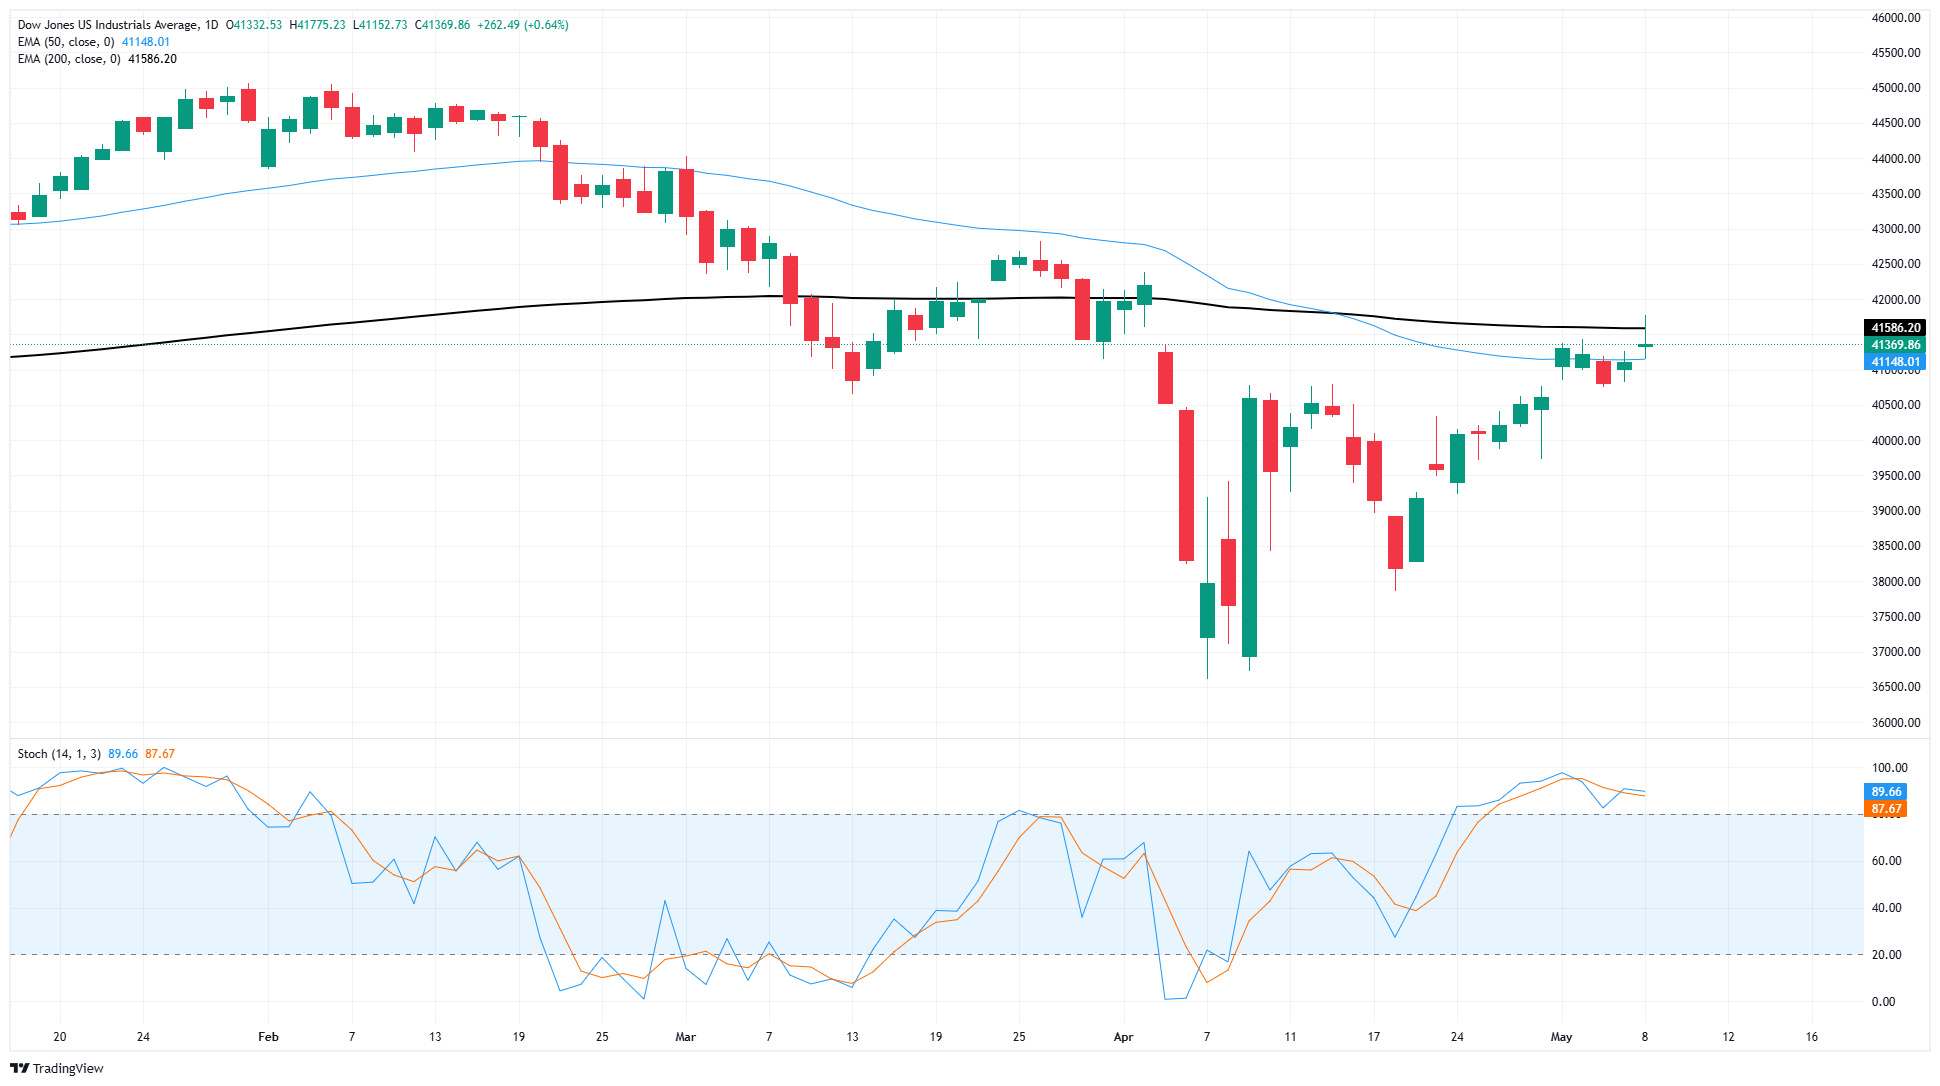
Thursday’s trade-fueled bull run briefly put the Dow Jones back on the high side of the 200-day Exponential Moving Average (EMA) near 41,600 for the first time since early April. The major equity index has climbed over 14% after bottoming out near 36,615, also in early April.
The Dow Jones has nearly finished a full recovery from the tariff rout that dragged the DJIA down the 42,175 region. However, bullish momentum remains tepid overall, and technical oscillators are fully pinned in overbought territory, strongly implying that the Dow Jones’ battle with the 200-day EMA may not be over yet.
Dow Jones daily chart
Dow Jones FAQs
The Dow Jones Industrial Average, one of the oldest stock market indices in the world, is compiled of the 30 most traded stocks in the US. The index is price-weighted rather than weighted by capitalization. It is calculated by summing the prices of the constituent stocks and dividing them by a factor, currently 0.152. The index was founded by Charles Dow, who also founded the Wall Street Journal. In later years it has been criticized for not being broadly representative enough because it only tracks 30 conglomerates, unlike broader indices such as the S&P 500.
Many different factors drive the Dow Jones Industrial Average (DJIA). The aggregate performance of the component companies revealed in quarterly company earnings reports is the main one. US and global macroeconomic data also contributes as it impacts on investor sentiment. The level of interest rates, set by the Federal Reserve (Fed), also influences the DJIA as it affects the cost of credit, on which many corporations are heavily reliant. Therefore, inflation can be a major driver as well as other metrics which impact the Fed decisions.
Dow Theory is a method for identifying the primary trend of the stock market developed by Charles Dow. A key step is to compare the direction of the Dow Jones Industrial Average (DJIA) and the Dow Jones Transportation Average (DJTA) and only follow trends where both are moving in the same direction. Volume is a confirmatory criteria. The theory uses elements of peak and trough analysis. Dow’s theory posits three trend phases: accumulation, when smart money starts buying or selling; public participation, when the wider public joins in; and distribution, when the smart money exits.
There are a number of ways to trade the DJIA. One is to use ETFs which allow investors to trade the DJIA as a single security, rather than having to buy shares in all 30 constituent companies. A leading example is the SPDR Dow Jones Industrial Average ETF (DIA). DJIA futures contracts enable traders to speculate on the future value of the index and Options provide the right, but not the obligation, to buy or sell the index at a predetermined price in the future. Mutual funds enable investors to buy a share of a diversified portfolio of DJIA stocks thus providing exposure to the overall index.
Author

Joshua Gibson
FXStreet
Joshua joins the FXStreet team as an Economics and Finance double major from Vancouver Island University with twelve years' experience as an independent trader focusing on technical analysis.


