Dow Jones Industrial Average leaks upward as tech rally drags equities higher
- The Dow Jones took a meager step upward on Thursday, clawing into record highs.
- The tech sector is taking the biggest step, bolstered by the ongoing AI rally.
- The Fed’s rate cut and tease of more cuts to come has lifted investor sentiment.

The Dow Jones Industrial Average (DJIA) rose on renewed bullish sentiment across broader markets on Thursday, bolstered by the Federal Reserve’s (Fed) decision to cut interest rates for the first time in nine months. The tech rally has extended its legs, both on the hope that declining interest rates will reinvigorate business investment across the space, as well as a new investment pivot by major players in the AI segment.
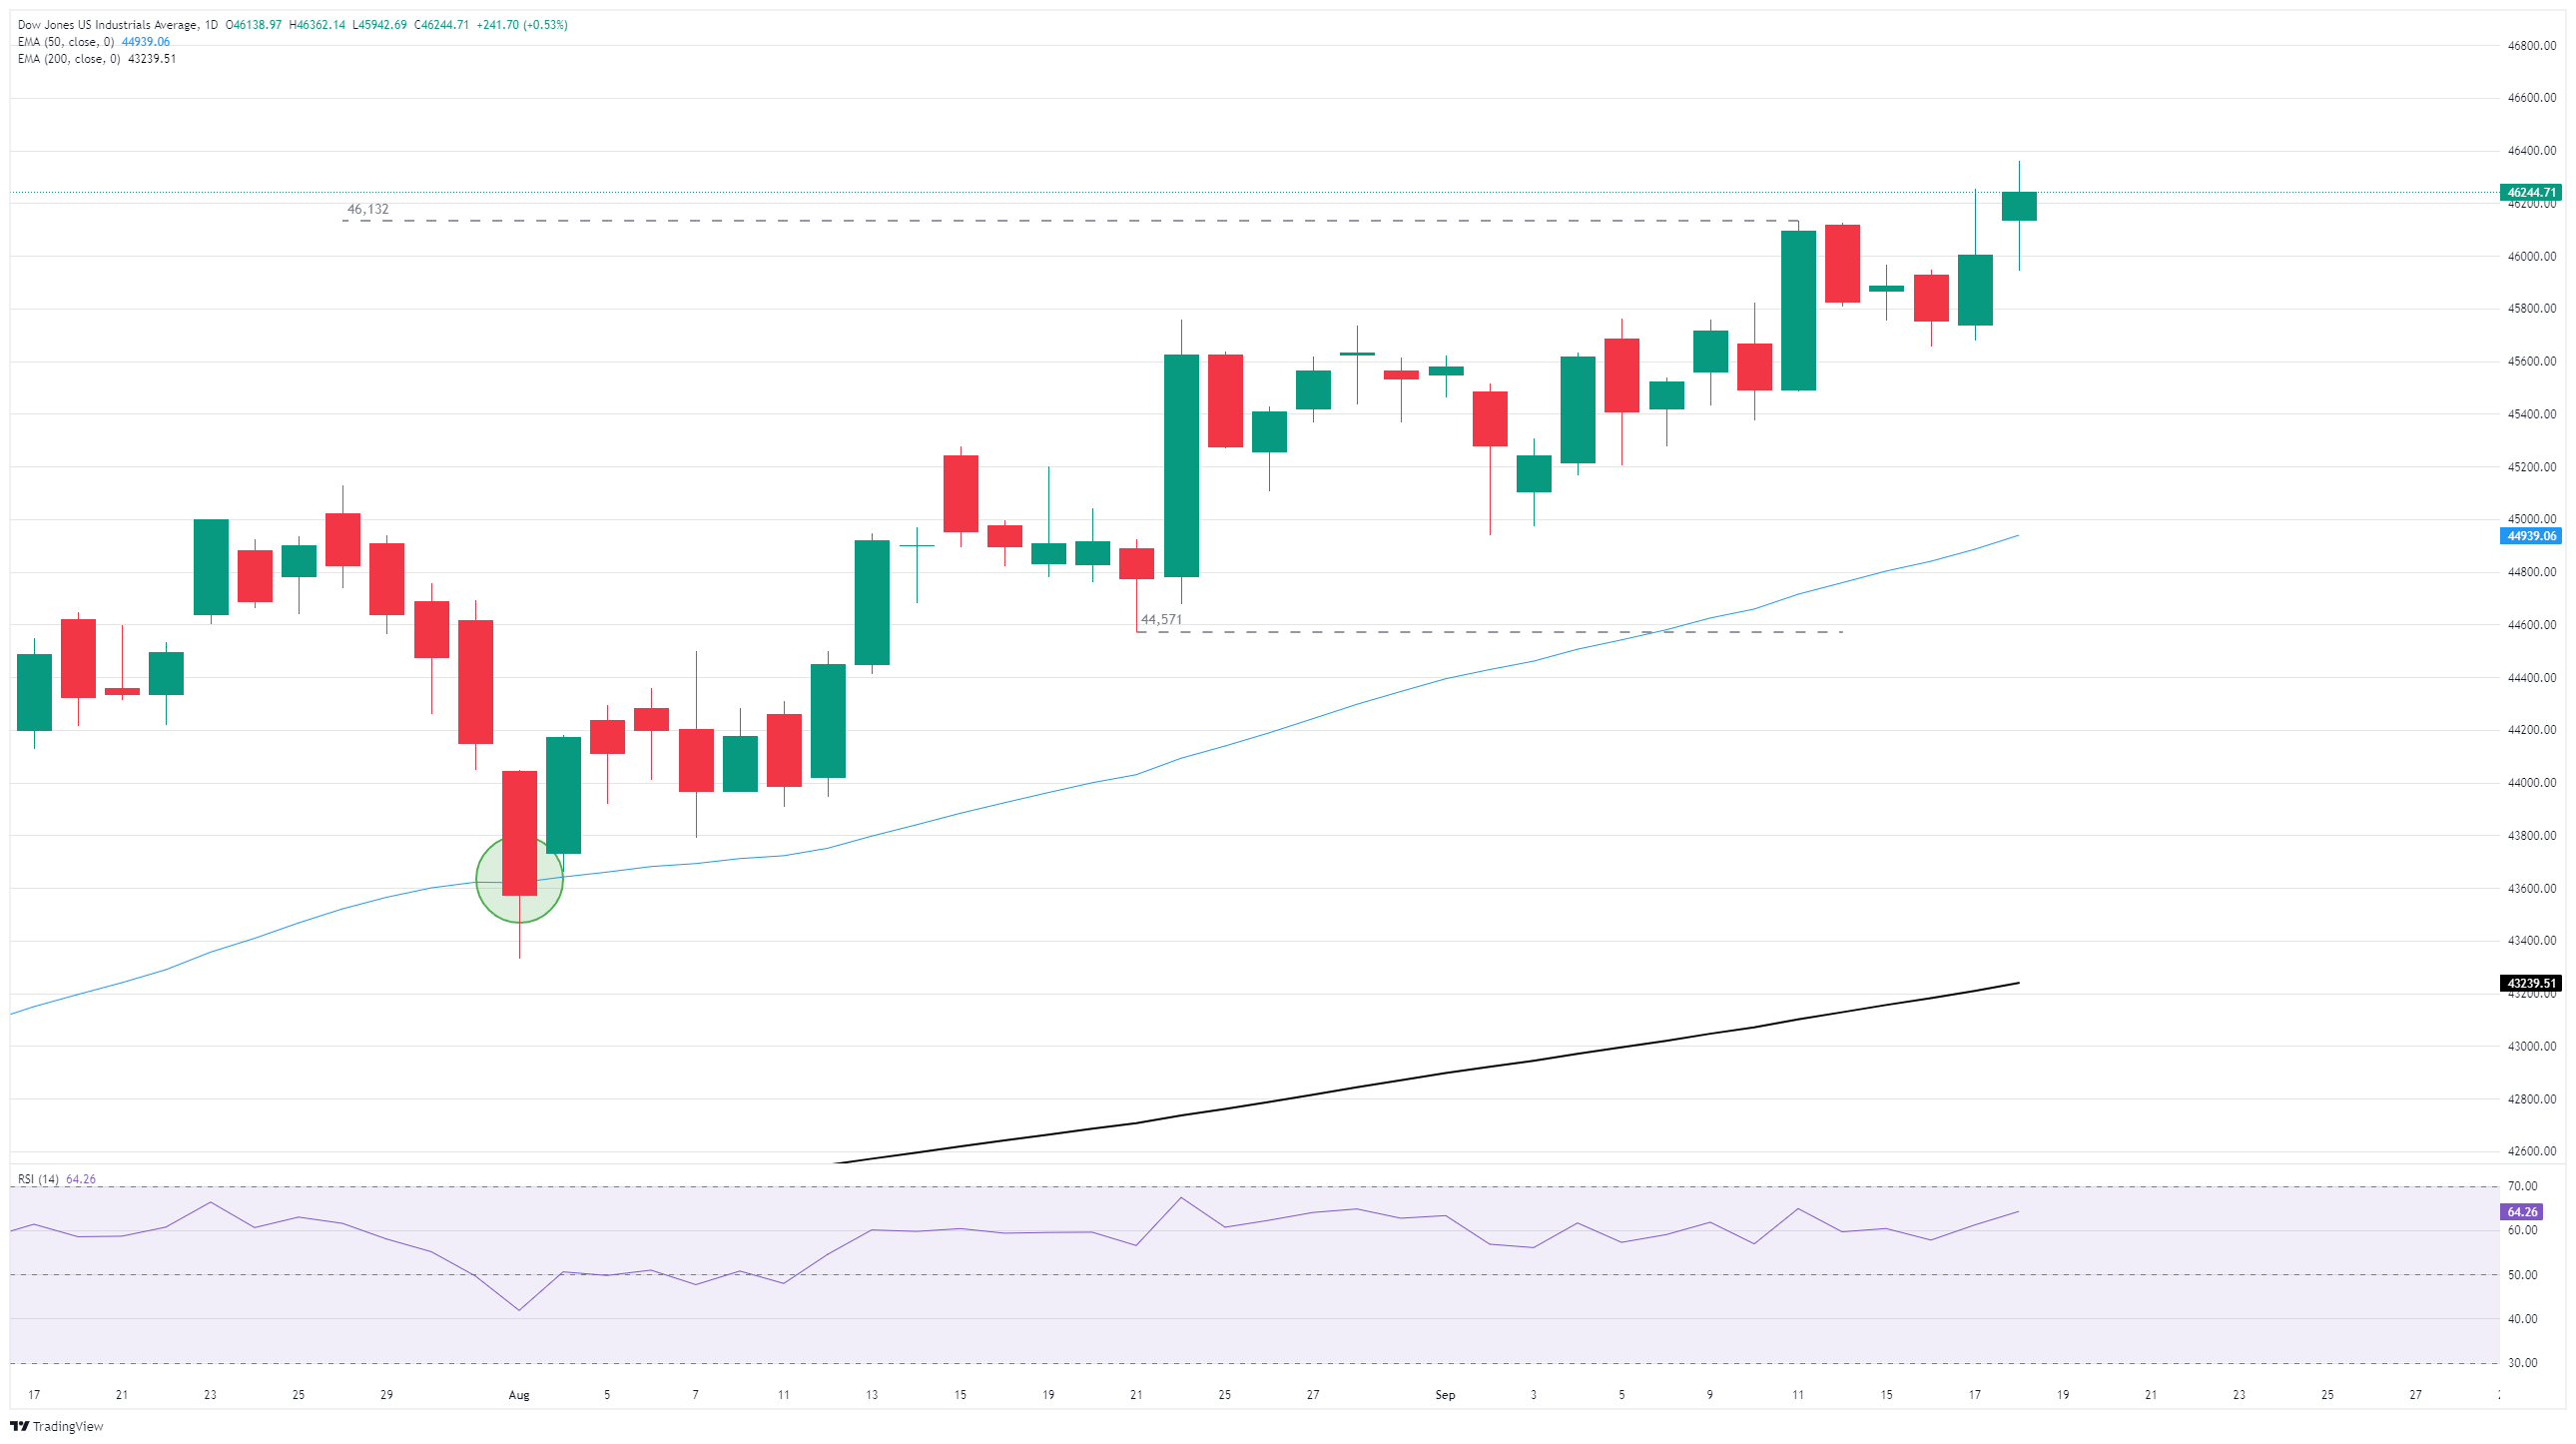
The Dow Jones clipped into the 46,200 level after a volatile start to Thursday’s trading session. The major equity index has climbed into fresh record bids following a near-term spat of congestion, but it is now up nearly eight-tenths of one percent for the week. The Dow Jones is also in the green by one-and-a-half percent for September, and on pace for a fifth straight bullish monthly close.
Rate cuts and AI investment bolster indexes
The Fed’s quarter-point rate cut this week helped to bolster market confidence that equities will continue to bleed higher despite deep cracks beginning to surface in key macro datasets, suggesting that the US economy may be on shakier footing than previously believed. Weekly Initial Jobless Claims dipped to 231K, coming in below the expected 240K, and is a welcome reprieve from the steady flow of bad news around the labor market.
Still, not all is rosy in the underlying data: despite a slight easing in the 4-week average of Initial Jobless Claims to 240K, the rolling average is still a sight higher than it was at the beginning of the year when it was sitting in the 212K to 213K range.
AI tech rally giant Nvidia (NVDA) has announced a plan to invest $5 billion in lagging tech has-been Intel (INTC). Intel stock soared around 30% on Thursday, clipping above $31.50 per share, while Nvidia added 3.75% to test $176.70 per share. The investment will give Intel, a shadow of its former chip-dominant self, a second wind to try and re-enter the AI hardware arms race. However, this is not the first time that either Invidia or Intel has attempted to brute force a late entry into an already-populated market segment with fizzling results.
According to Nvidia CEO Jensen Huang, his company's investment into Intel represents both tech giants' efforts to focus on new chip technology. Nvidia's CEO stated that the investment would open up "brand new growth markets" for Intel, and would help address a $25B-$50B market.
Read more stock news: Intel stock surges over 30% after Nvidia takes $5 billion stake
Dow Jones daily chart
Dow Jones FAQs
The Dow Jones Industrial Average, one of the oldest stock market indices in the world, is compiled of the 30 most traded stocks in the US. The index is price-weighted rather than weighted by capitalization. It is calculated by summing the prices of the constituent stocks and dividing them by a factor, currently 0.152. The index was founded by Charles Dow, who also founded the Wall Street Journal. In later years it has been criticized for not being broadly representative enough because it only tracks 30 conglomerates, unlike broader indices such as the S&P 500.
Many different factors drive the Dow Jones Industrial Average (DJIA). The aggregate performance of the component companies revealed in quarterly company earnings reports is the main one. US and global macroeconomic data also contributes as it impacts on investor sentiment. The level of interest rates, set by the Federal Reserve (Fed), also influences the DJIA as it affects the cost of credit, on which many corporations are heavily reliant. Therefore, inflation can be a major driver as well as other metrics which impact the Fed decisions.
Dow Theory is a method for identifying the primary trend of the stock market developed by Charles Dow. A key step is to compare the direction of the Dow Jones Industrial Average (DJIA) and the Dow Jones Transportation Average (DJTA) and only follow trends where both are moving in the same direction. Volume is a confirmatory criteria. The theory uses elements of peak and trough analysis. Dow’s theory posits three trend phases: accumulation, when smart money starts buying or selling; public participation, when the wider public joins in; and distribution, when the smart money exits.
There are a number of ways to trade the DJIA. One is to use ETFs which allow investors to trade the DJIA as a single security, rather than having to buy shares in all 30 constituent companies. A leading example is the SPDR Dow Jones Industrial Average ETF (DIA). DJIA futures contracts enable traders to speculate on the future value of the index and Options provide the right, but not the obligation, to buy or sell the index at a predetermined price in the future. Mutual funds enable investors to buy a share of a diversified portfolio of DJIA stocks thus providing exposure to the overall index.
Author

Joshua Gibson
FXStreet
Joshua joins the FXStreet team as an Economics and Finance double major from Vancouver Island University with twelve years' experience as an independent trader focusing on technical analysis.