Dow Jones Industrial Average eases lower as investors rethink shutdown risks
- The Dow Jones backslid into the 46,500 region on Tuesday.
- Investors are waking up to the negative impacts of a government shutdown.
- Interest rate expectations and Fedspeak dominate market flows this week.

The Dow Jones Industrial Average (DJIA) knocked lower on Tuesday, following the broader market into the low side. Investors are reconsidering their disregard for the US government shutdown that has dragged into its second week and shows no signs of resolution.
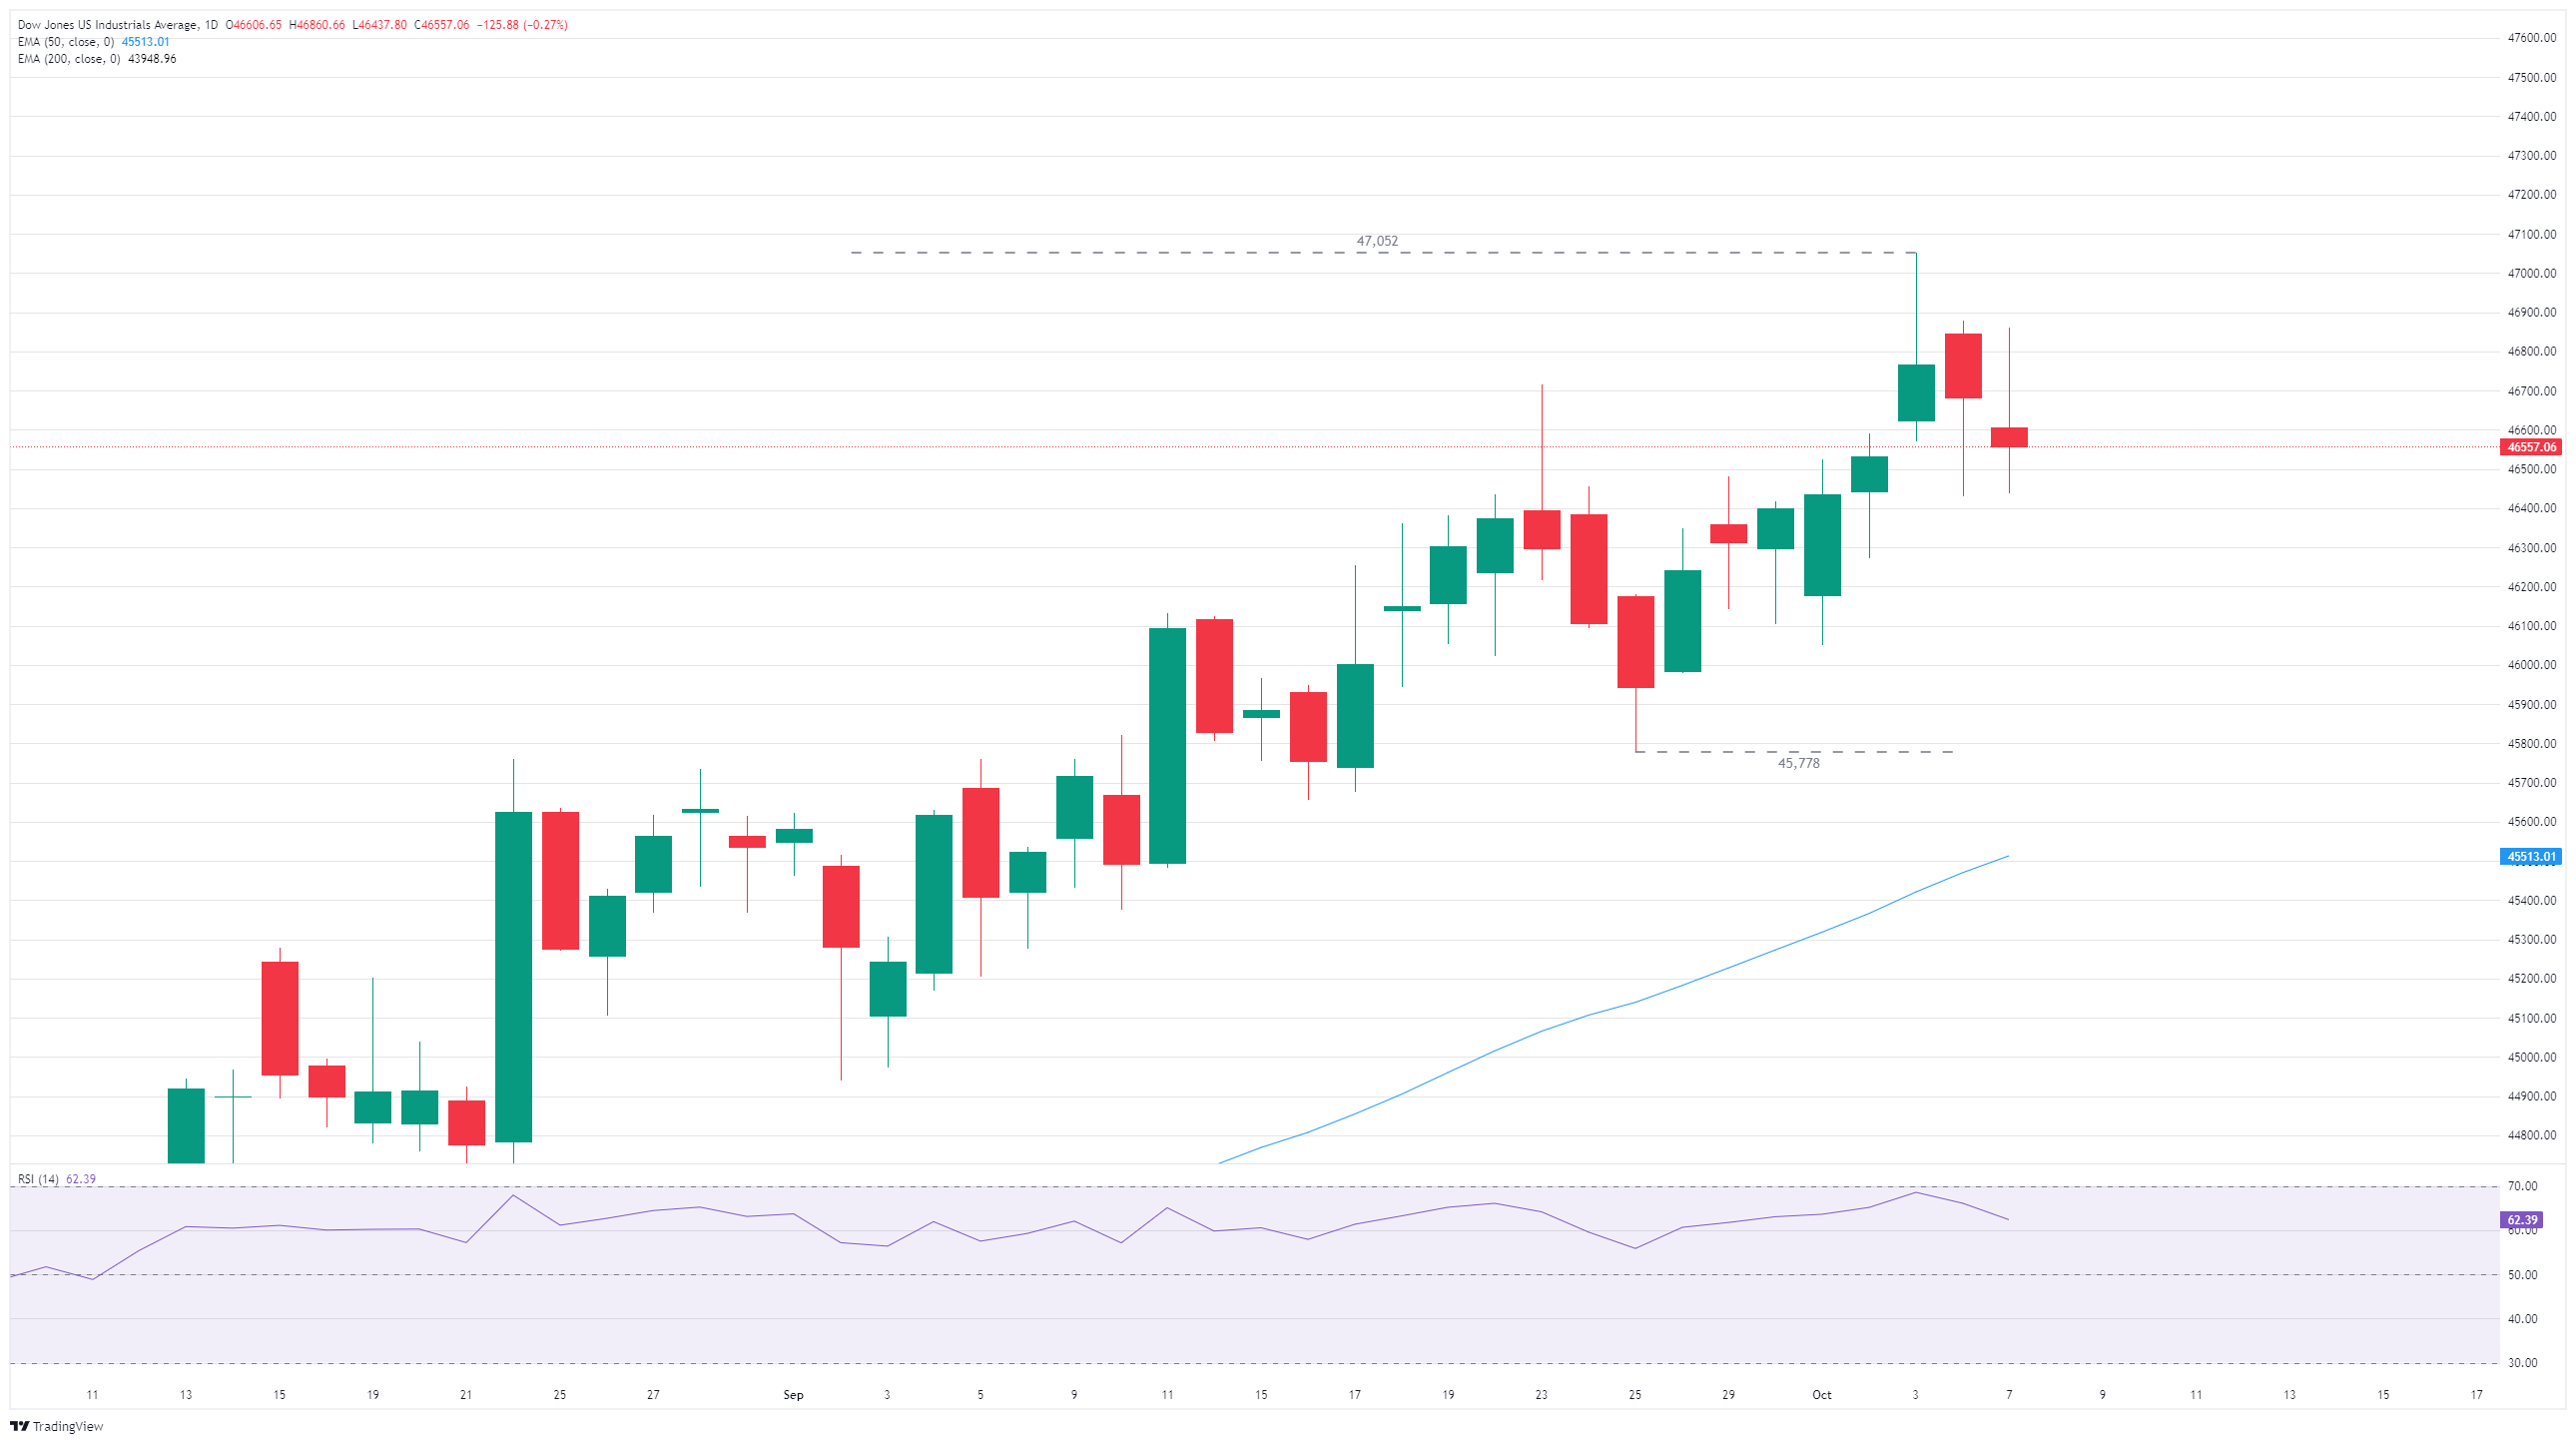
The Dow kicked off Tuesday with a hard drop from overnight highs above 46,800, falling over 420 points top-to-bottom before finding an intraday floor of 46,430. The Dow equity index is now looking for a rebound after finding a technical floor near 46,500.
The Dow Jones ended Tuesday's American session down a little over 100 points from the day's open, closing out near 46,590. The Standard & Poor's 500 (SP500) equity index snapped a seven-day winning streak, shedding four-tenths of one percent on the day, while the tech-heavy NASDAQ 100 fell 153 points to end the day around two-thirds of one percent lower.
Oracle gives back some AI hype gains
After a firm surge on expectations of soaring AI-based revenue and joint projects, Oracle (ORCL) led the pack lower, falling after real-world estimates of profits from joint servicing ventures in the AI space fell well short of initial investor reactions. Oracle is generating much thinner profit margins on its cloud business than many expected, and is actually losing money on some of its chip rental schemes with Nvidia (NVDA). Oracle is down nearly 4.5% at the time of publication and has fallen below $280.00 per share.
Government shutdowns may impact some things after all
Investors have been brushing off the US federal government’s shutdown last week, with markets confident that a quick resolution would be found and economic fallout would be minimal. That confidence may prove to have been misplaced, as both sides of the US Congress appear to be no closer to a budget solution than before the lockout began. Traders expected a budget solution to materialize on Monday, or at least some form of progress to have been made.
As the government shutdown rolls on, the Federal Reserve (Fed) will be grappling with a lack of key official datasets as it makes interest rate decisions heading into the tail end of the calendar year. Barring any significant shocks in the data that remains available to the Fed, rate markets have locked in expectations of two follow-up interest rate cuts on October 29 and December 10.
Dow Jones daily chart
Dow Jones FAQs
The Dow Jones Industrial Average, one of the oldest stock market indices in the world, is compiled of the 30 most traded stocks in the US. The index is price-weighted rather than weighted by capitalization. It is calculated by summing the prices of the constituent stocks and dividing them by a factor, currently 0.152. The index was founded by Charles Dow, who also founded the Wall Street Journal. In later years it has been criticized for not being broadly representative enough because it only tracks 30 conglomerates, unlike broader indices such as the S&P 500.
Many different factors drive the Dow Jones Industrial Average (DJIA). The aggregate performance of the component companies revealed in quarterly company earnings reports is the main one. US and global macroeconomic data also contributes as it impacts on investor sentiment. The level of interest rates, set by the Federal Reserve (Fed), also influences the DJIA as it affects the cost of credit, on which many corporations are heavily reliant. Therefore, inflation can be a major driver as well as other metrics which impact the Fed decisions.
Dow Theory is a method for identifying the primary trend of the stock market developed by Charles Dow. A key step is to compare the direction of the Dow Jones Industrial Average (DJIA) and the Dow Jones Transportation Average (DJTA) and only follow trends where both are moving in the same direction. Volume is a confirmatory criteria. The theory uses elements of peak and trough analysis. Dow’s theory posits three trend phases: accumulation, when smart money starts buying or selling; public participation, when the wider public joins in; and distribution, when the smart money exits.
There are a number of ways to trade the DJIA. One is to use ETFs which allow investors to trade the DJIA as a single security, rather than having to buy shares in all 30 constituent companies. A leading example is the SPDR Dow Jones Industrial Average ETF (DIA). DJIA futures contracts enable traders to speculate on the future value of the index and Options provide the right, but not the obligation, to buy or sell the index at a predetermined price in the future. Mutual funds enable investors to buy a share of a diversified portfolio of DJIA stocks thus providing exposure to the overall index.
Author

Joshua Gibson
FXStreet
Joshua joins the FXStreet team as an Economics and Finance double major from Vancouver Island University with twelve years' experience as an independent trader focusing on technical analysis.

















