Dow Jones Industrial Average softens bullish stance as markets wait for budget and trade headlines
- The Dow Jones remained stuck in place near 42,800 on Tuesday.
- The market rally fueled by optimism on continued tariff walkbacks may be slowing.
- US government budget battle continues as Trump administration struggles to muscle through large deficits.

The Dow Jones Industrial Average (DJIA) hit a pause in its recent bullish momentum, backsliding into the 24,500 region on Tuesday. Equities are taking a breather from their post-tariff recovery rally as investors await meaningful progress on trade talks.
The Trump administration is hitting a snag trying to get its budget muscled through Congress, complicating matters for President Donald Trump. Contrary to Trump’s campaign promises of eliminating the federal budget deficit within his first six months in office and eliminating the US federal debt load within “a couple of years”, his budget proposal, which he has coined his “big, beautiful bill” is expected to add nearly 4 trillion dollars to the US government’s debt pile over the next ten years. The tax and spending bill, which includes steep spending cuts to many federal services, but also includes severe reductions in government tax receipts, is facing stiff opposition from within Trump’s own Republican party as hardline contingents of representatives fundamentally disagree on aspects of the budget.
According to some hardline Republicans, the tax bill doesn’t include enough cuts to essential services spending. Other Republicans are upset that the budget does the exact opposite of Trump’s campaign platform of reducing government spending, and instead adds significantly to the US’s debt load.
Tariffs still loom large, but markets hopeful for a solution
The Trump administration has been pushing hard to announce a slew of trade deals ahead of the end of the 90-day reprieve from its own “reciprocal tariffs”. Market sentiment remains firmly pinned to hopes that the Trump administration will achieve what it needs in order to pull the barrel away from its own foot on global trade. Investment managers have noticed the lack of hard factors underpinning stock market bullishness, with US Bank Wealth Management investment director Bill Northey noting that markets are a state of “optimism without clarity”, stating:
I would say that the largest consideration is the fact that we’ve had the swoon related to the introduction of tariffs, the furious rally associated with the de-escalation of those tariff implementations, and now we’re awaiting clarification as many of these negotiations are ongoing.
Read more stock news: Home Depot advances as Q1 sales outperform consensus
Dow Jones price forecast
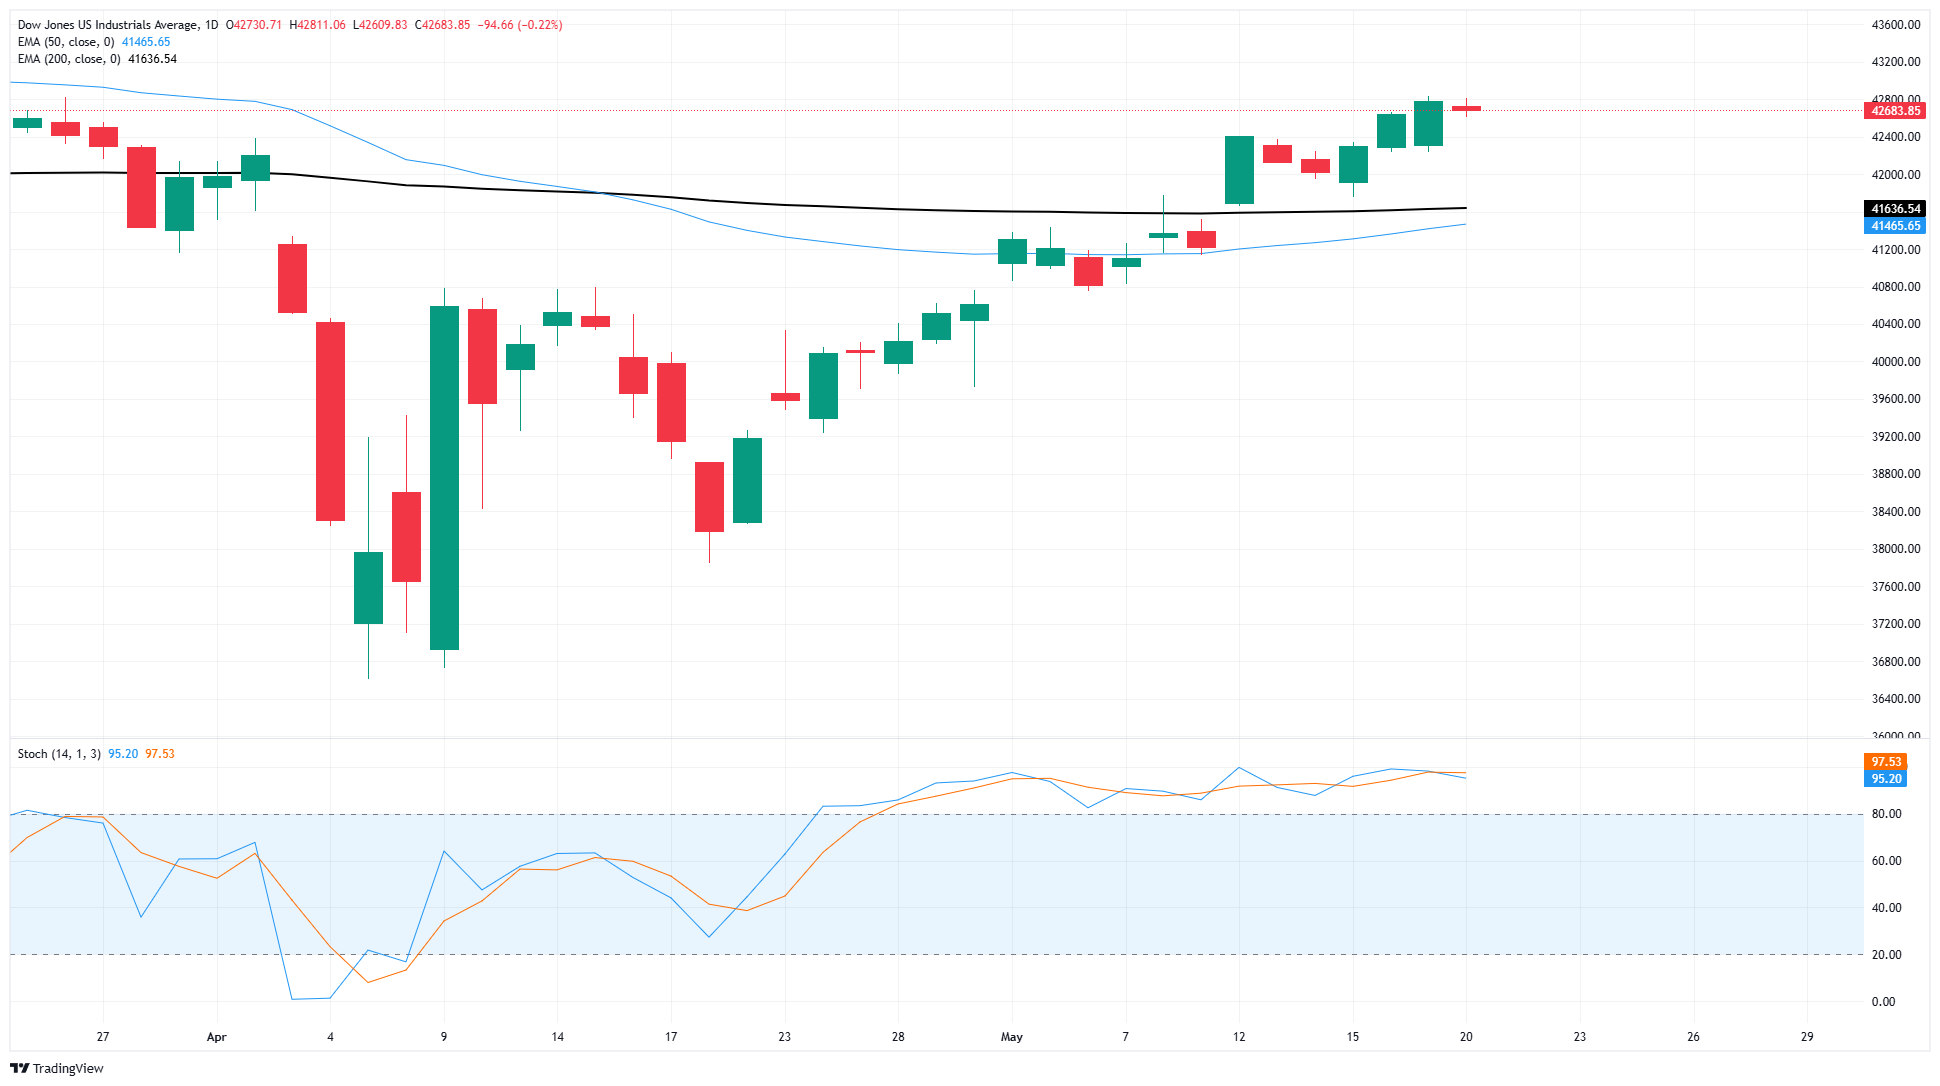
The Dow Jones Industrial Average hit a soft patch in momentum on Tuesday, holding steady after a three-day win streak. The Dow Jones remains firmly planted in bullish territory, having closed flat or higher for all but five of the last 19 consecutive trading sessions.
Despite the cooler market activity on Tuesday, the major equity index has closed higher for four straight weeks and is on track for a fifth consecutive bullish week following a strong start this week.. The Dow Jones has continued to climb above the 200-day Exponential Moving Average (EMA) around 41,500, and has increased almost 17% since April’s tariff-induced drop that saw the DJIA fall to 36,600.
Dow Jones daily chart
Economic Indicator
S&P Global Composite PMI
The S&P Global Composite Purchasing Managers Index (PMI), released on a monthly basis, is a leading indicator gauging US private-business activity in the manufacturing and services sector. The data is derived from surveys to senior executives. Each response is weighted according to the size of the company and its contribution to total manufacturing or services output accounted for by the sub-sector to which that company belongs. Survey responses reflect the change, if any, in the current month compared to the previous month and can anticipate changing trends in official data series such as Gross Domestic Product (GDP), industrial production, employment and inflation. The index varies between 0 and 100, with levels of 50.0 signaling no change over the previous month. A reading above 50 indicates that the private economy is generally expanding, a bullish sign for the US Dollar (USD). Meanwhile, a reading below 50 signals that activity is generally declining, which is seen as bearish for USD.
Read more.Next release: Thu May 22, 2025 13:45 (Prel)
Frequency: Monthly
Consensus: -
Previous: 50.6
Source: S&P Global
Author

Joshua Gibson
FXStreet
Joshua joins the FXStreet team as an Economics and Finance double major from Vancouver Island University with twelve years' experience as an independent trader focusing on technical analysis.


