Dow Jones Industrial Average churns with Trump's new tariffs and "firm" deadlines
- The Dow Jones churned the charts on Tuesday as investors continue to await clarity.
- Second verse, same as the first: Trump says new tariff deadline will not be canceled or extended.
- Additional double-digit tariff levels have been announced by Trump, crimping market sentiment.

The Dow Jones Industrial Average (DJIA) struggled to maintain its balance on Tuesday, churning chart paper near 44,350 as the Trump administration angles to keep the pressure on trade talks. President Trump announced additional tariffs of 25% on all imports from South Korea and Japan, set to come into effect on August 1 alongside the twice-delayed reciprocal tariffs announced in early April.
Echoes of the past: no tariff delays, and this time we mean it
Donald Trump has listed 14 countries that will face additional tariffs on August 1 if trade deals aren’t secured by that date. In echoes of previous warnings delivered by Trump himself, the August 1 deadline for reciprocal tariffs is set in stone and won’t be delayed or suspended. The exact same cautionary statement was made by Trump as recently as last week, regarding the July 9 reciprocal tariff deadline, which has since been delayed or suspended. In another repeat of past tariff announcements, Trump's messaging on the new August 1 deadline remains fluid: Trump announced that countries may earn an exemption or suspension through trade talks, but then declared on Tuesday that the August 1 deadline is firm and unavoidable.
Adding further pressure to markets, President Trump also announced on Tuesday that he would be kicking off a 50% tariff on all copper imports into the US, and would be enacting it "today". Weighed down by constant on-again, off-again tariff threats, markets are betting that the overwhelming majority of Trump's tariffs will not come to pass.
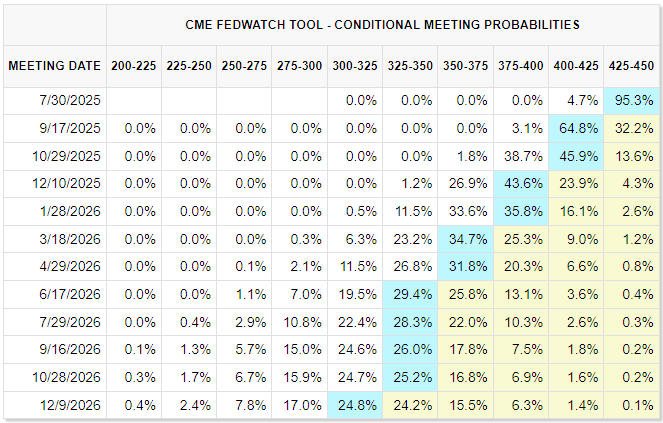
Economic data remains limited throughout the week, giving investors some room to breathe on the data front following last week’s tumultuous labor data dump. The Meeting Minutes from the Federal Reserve’s (Fed) latest rate discussions will be released on Wednesday, giving market participants a closer look at how near or far the Fed might be from delivering its next rate cut. As trade talk continues to heat up while also getting kicked further down the road, the odds of a quarter-point rate cut are looking less like a sure thing. According to the CME’s FedWatch tool, the chances of a push to October are rising in rate markets.
Dow Jones price forecast
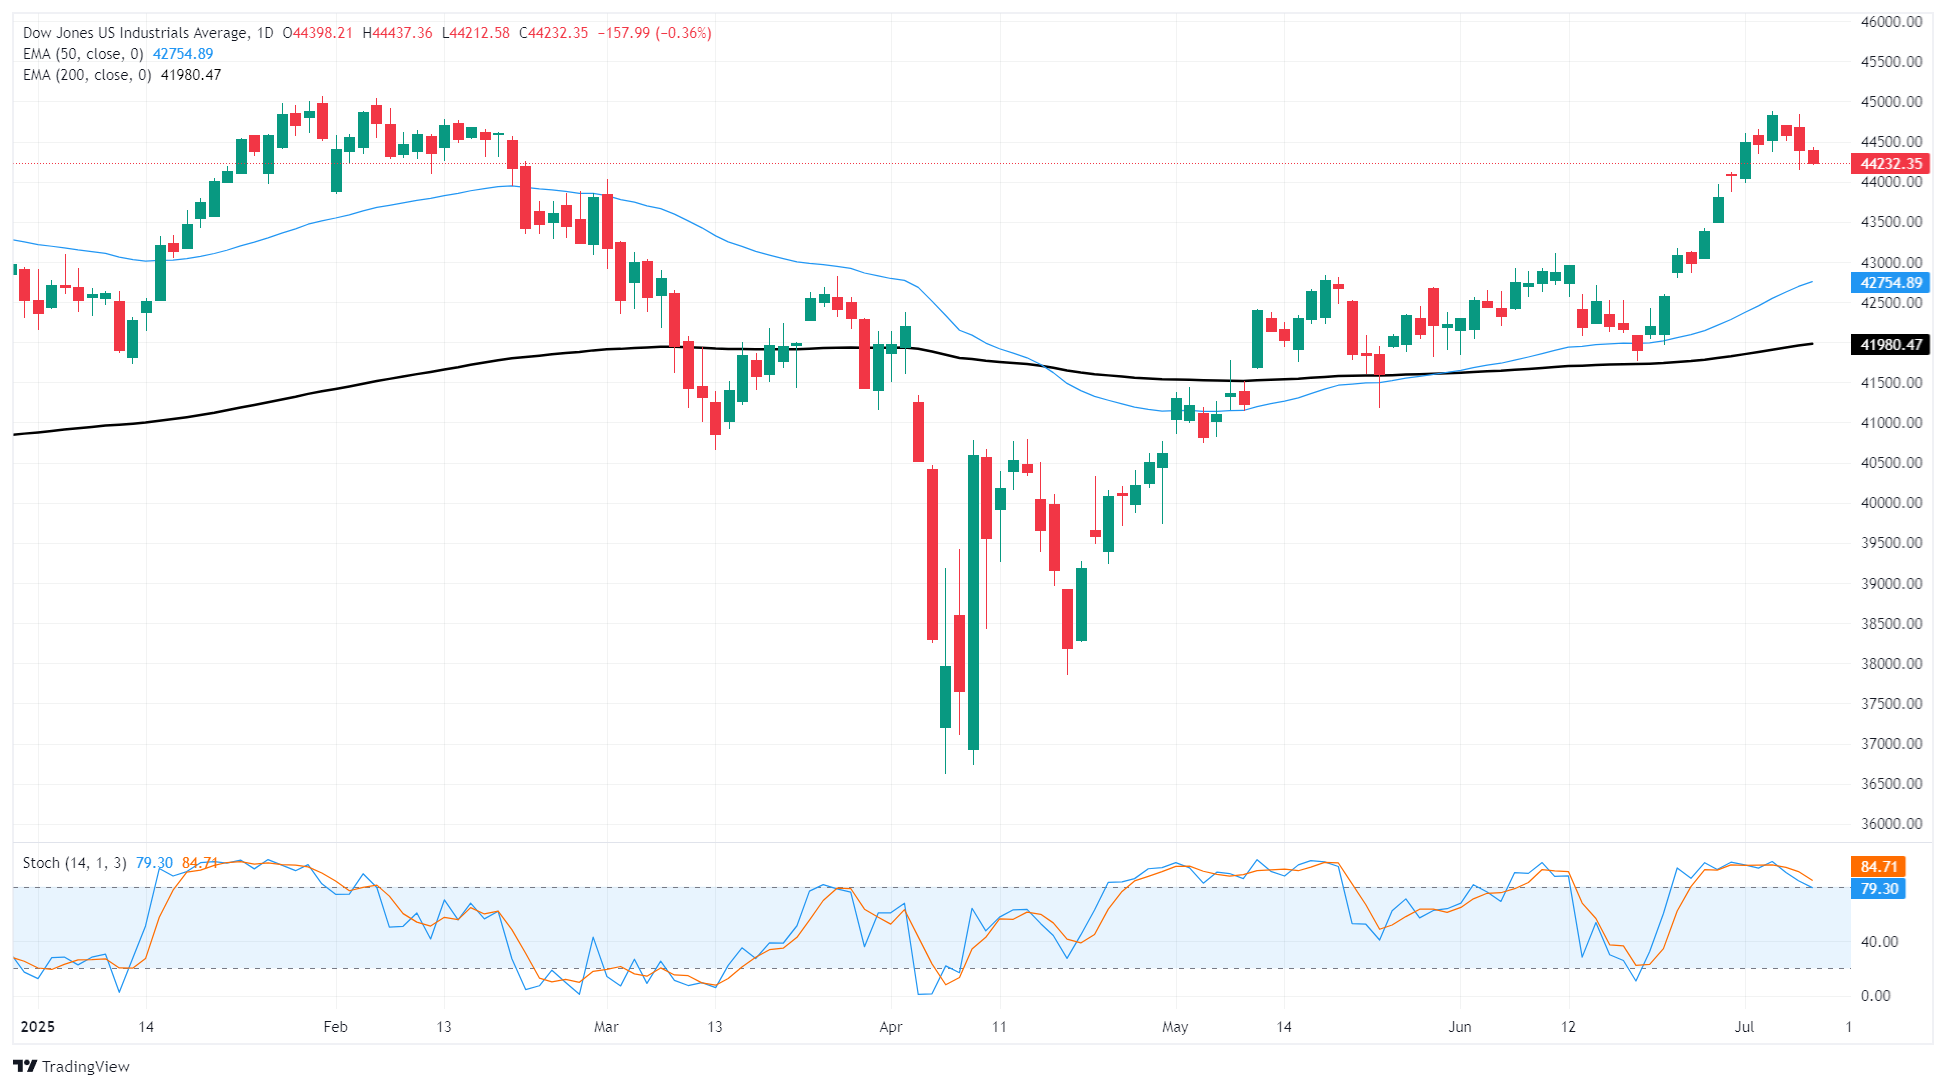
A fresh bout of technical weakness has dragged the Dow Jones Industrial Average back below 44,400 following a strong bullish performance through the last third of June. The major equity index peaked near 44,800, failing to breach all-time highs north of the 45,000 handle.
Despite a near-term pivot into the bearish side, the Dow remains firmly planted in bull country, trading far above the 200-day Exponential Moving Average (EMA) 42,460. A continued grind into the low side could be on the cards with technical oscillators still pinned in overbought territory, but near-term declines will likely crystallize into new buying opportunities.
Dow Jones daily chart
Dow Jones FAQs
The Dow Jones Industrial Average, one of the oldest stock market indices in the world, is compiled of the 30 most traded stocks in the US. The index is price-weighted rather than weighted by capitalization. It is calculated by summing the prices of the constituent stocks and dividing them by a factor, currently 0.152. The index was founded by Charles Dow, who also founded the Wall Street Journal. In later years it has been criticized for not being broadly representative enough because it only tracks 30 conglomerates, unlike broader indices such as the S&P 500.
Many different factors drive the Dow Jones Industrial Average (DJIA). The aggregate performance of the component companies revealed in quarterly company earnings reports is the main one. US and global macroeconomic data also contributes as it impacts on investor sentiment. The level of interest rates, set by the Federal Reserve (Fed), also influences the DJIA as it affects the cost of credit, on which many corporations are heavily reliant. Therefore, inflation can be a major driver as well as other metrics which impact the Fed decisions.
Dow Theory is a method for identifying the primary trend of the stock market developed by Charles Dow. A key step is to compare the direction of the Dow Jones Industrial Average (DJIA) and the Dow Jones Transportation Average (DJTA) and only follow trends where both are moving in the same direction. Volume is a confirmatory criteria. The theory uses elements of peak and trough analysis. Dow’s theory posits three trend phases: accumulation, when smart money starts buying or selling; public participation, when the wider public joins in; and distribution, when the smart money exits.
There are a number of ways to trade the DJIA. One is to use ETFs which allow investors to trade the DJIA as a single security, rather than having to buy shares in all 30 constituent companies. A leading example is the SPDR Dow Jones Industrial Average ETF (DIA). DJIA futures contracts enable traders to speculate on the future value of the index and Options provide the right, but not the obligation, to buy or sell the index at a predetermined price in the future. Mutual funds enable investors to buy a share of a diversified portfolio of DJIA stocks thus providing exposure to the overall index.
Author

Joshua Gibson
FXStreet
Joshua joins the FXStreet team as an Economics and Finance double major from Vancouver Island University with twelve years' experience as an independent trader focusing on technical analysis.


