Dow Jones Industrial Average grapples with overloaded AI trade fears
- The Dow Jones eased lower on Tuesday, battling the 47,000 region.
- Equity markets showed their over-extended feathers as AI overvaluation fears loom.
- Private labor data due this week to take on added significance as official data remains dark.

The Dow Jones Industrial Average (DJIA) fell alongside its major index peers on Tuesday, shedding nearly 300 points from Monday’s closing prices as investors pivoted into fresh concerns that the global AI tech craze may have left equity markets overly concentrated in key stocks with dubious revenue power.
Dow Jones faces fresh weakness after posting record highs last week
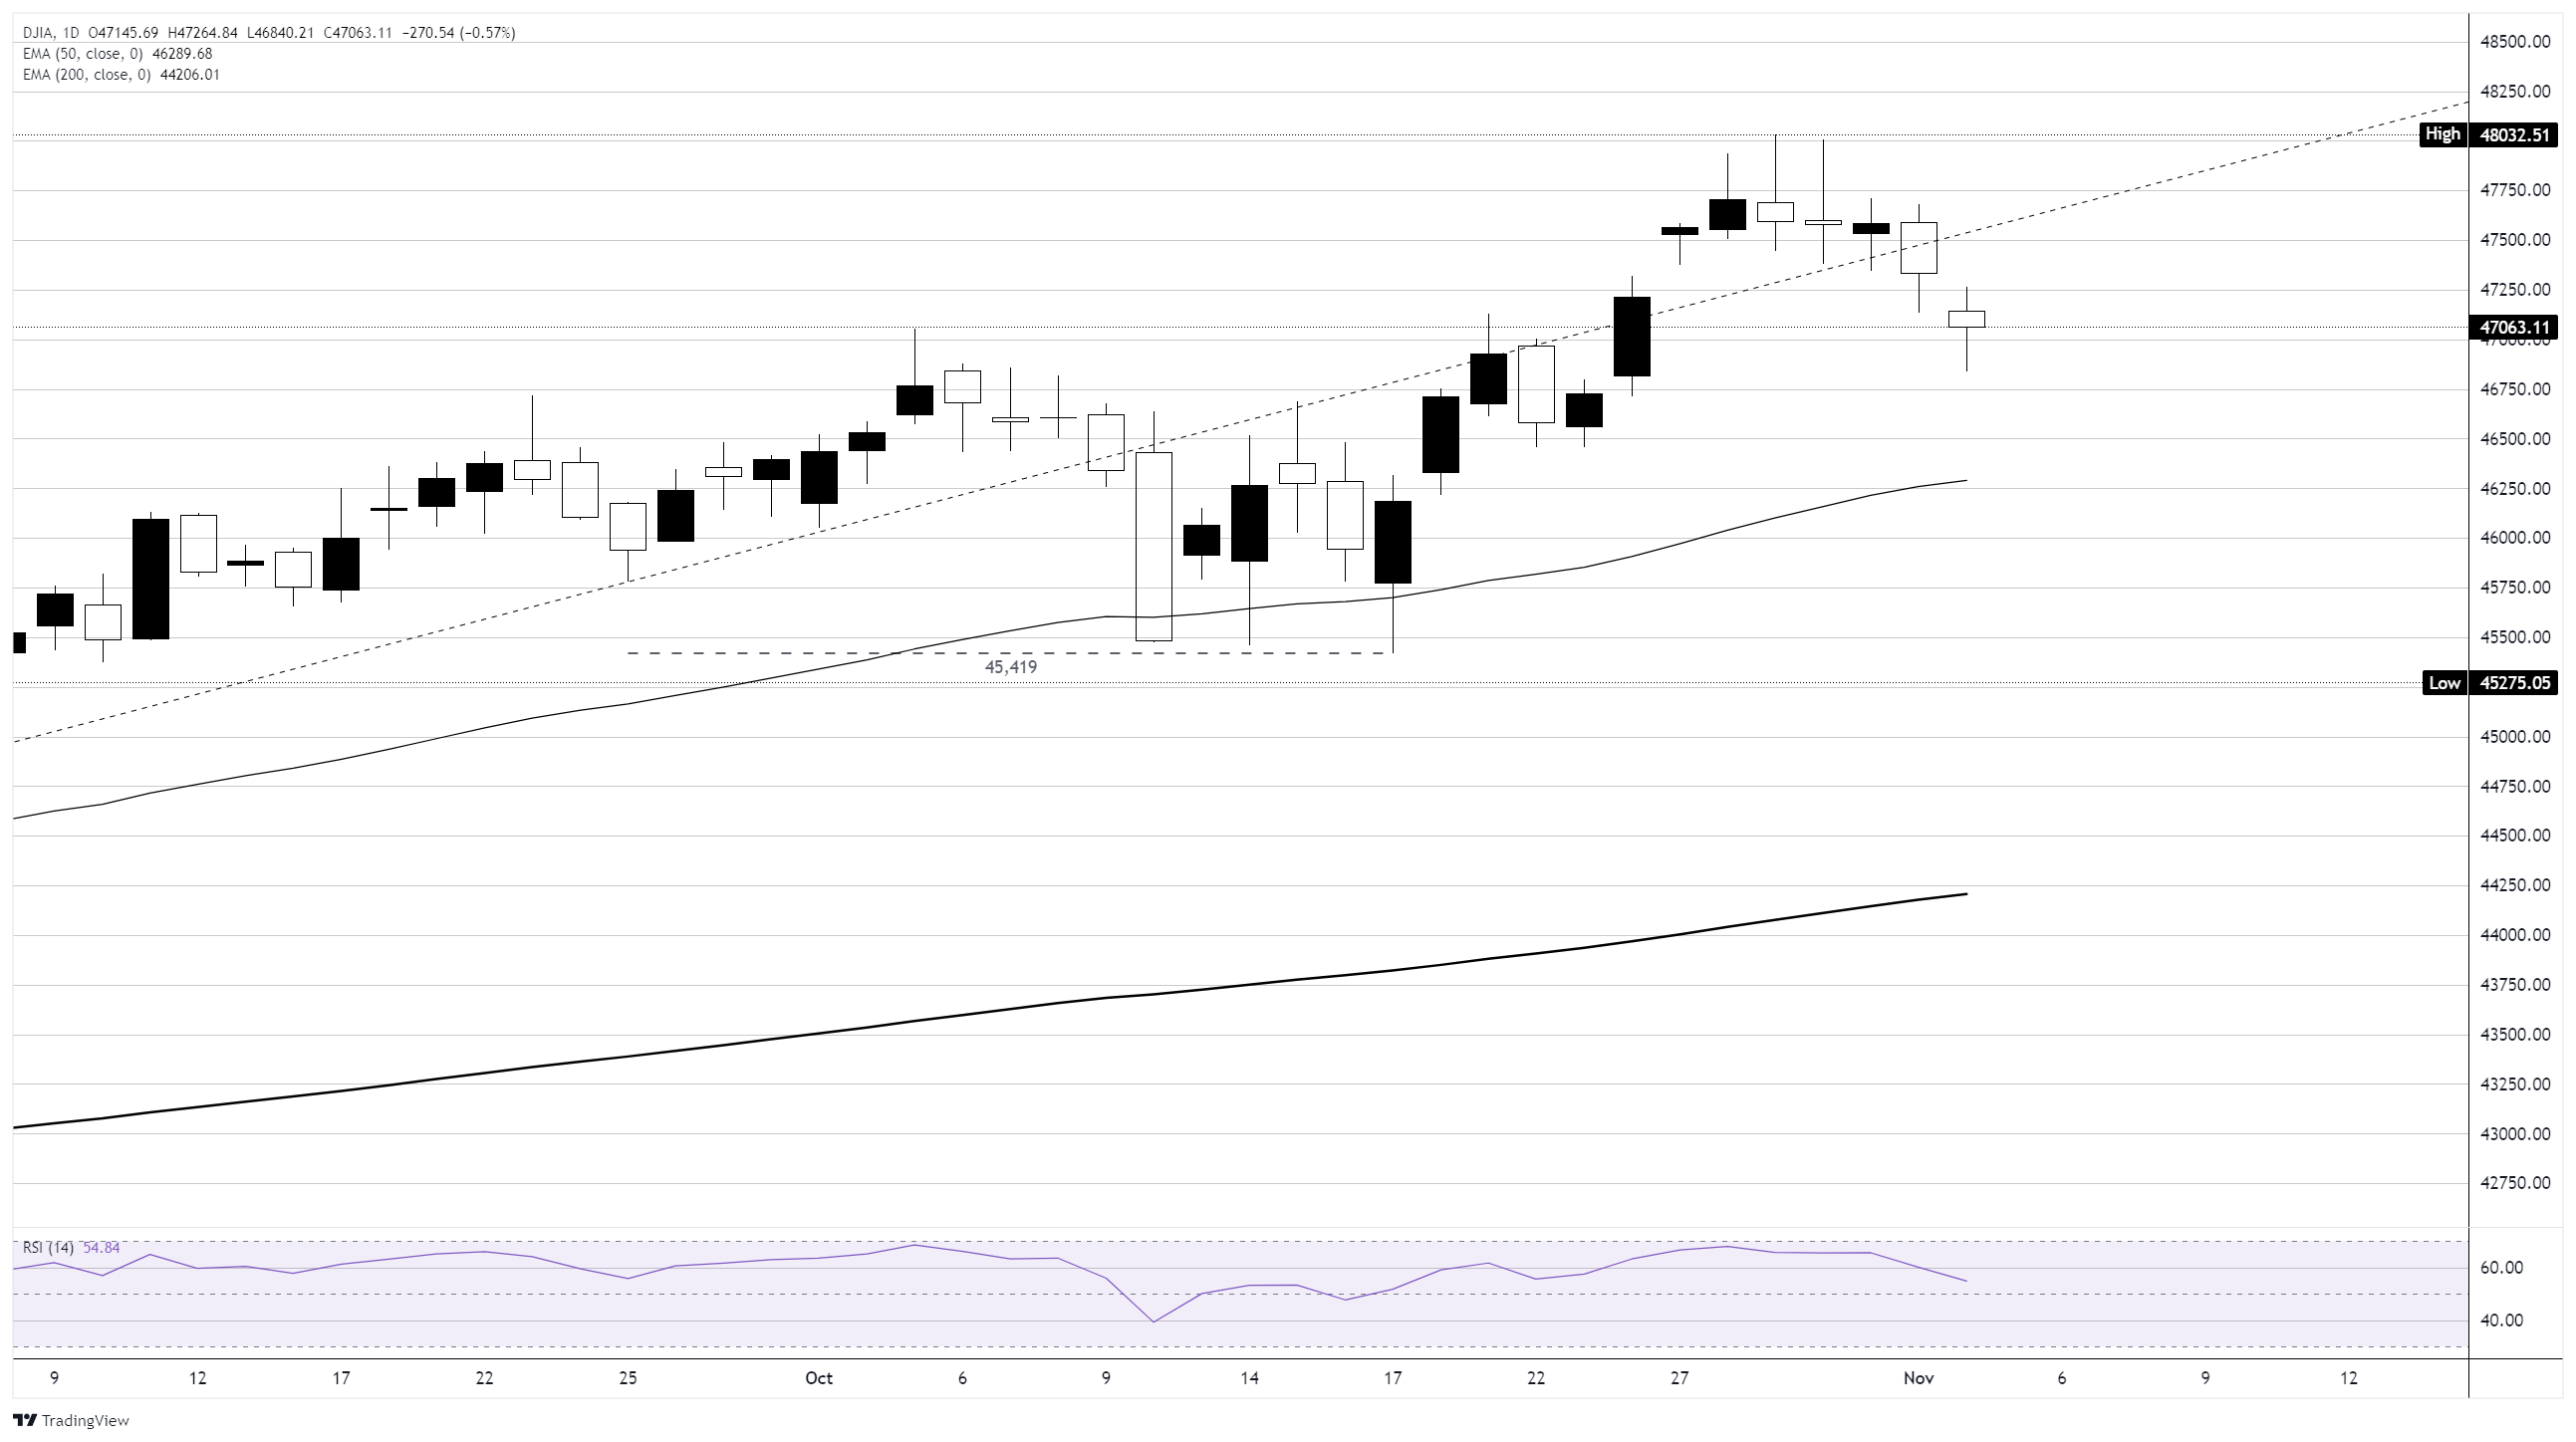
The Dow Jones fell to its lowest intraday prices in over a week, declining to 46,840 before finding a weak foothold near the 47,000 handle. With a mild pullback in AI tech stocks underway, the broader equity market is revealing some worrying red flags: Despite making thin gains on Monday, over 300 stocks listed on the Standard & Poor’s 500 (S&P 500) index closed in the red for the day, with any gains entirely at the hands of deeply concentrated tech rally darlings. With the self-feeding AI rally taking a breather on Tuesday, a notable lack of “breadth” in equities is rearing its head.
Key financial market players, most notably the CEOs of Goldman Sachs (GS) and Morgan Stanley (MS), took turns cautioning that overextended markets could be due for a pullback, with both megabank chairs warning of possible broad-market drawdowns in the 10-20% range over the next year or two. The Dow Jones is currently down a little over 2% from record highs just north of 48,000, reached just last week.
Palantir may not be worth two centuries' worth of earnings after all
As a perfect example of the market’s current lack of breadth, Palantir (PLTR) is down over 7% on Tuesday, declining sharply despite broadly beating Wall Street earnings expectations. Despite leaning heavily into the AI tech space and delivering plenty of headline-grabbing scratch for investors’ AI integration itch, the company still remains well short of delivering meaningful revenue gains on its most-championed segments. Investors may be starting to have doubts about Palantir carrying a forward P/E ratio somewhere between 200 and 700, depending on how you smash the balance sheet numbers together.
With real data on ice, ADP jobs data to step up
ADP Employment Change figures for October are due on Wednesday. ADP numbers have a historically disastrous correlation to actual official datasets from one release to the next, but that is unlikely to stop investors from placing additional importance on the volatile month-to-month ADP figure while the ongoing US government shutdown shuts off the flow of more meaningful sample estimates such as the Nonfarm Payrolls (NFP) jobs report.
Dow Jones daily chart
Dow Jones FAQs
The Dow Jones Industrial Average, one of the oldest stock market indices in the world, is compiled of the 30 most traded stocks in the US. The index is price-weighted rather than weighted by capitalization. It is calculated by summing the prices of the constituent stocks and dividing them by a factor, currently 0.152. The index was founded by Charles Dow, who also founded the Wall Street Journal. In later years it has been criticized for not being broadly representative enough because it only tracks 30 conglomerates, unlike broader indices such as the S&P 500.
Many different factors drive the Dow Jones Industrial Average (DJIA). The aggregate performance of the component companies revealed in quarterly company earnings reports is the main one. US and global macroeconomic data also contributes as it impacts on investor sentiment. The level of interest rates, set by the Federal Reserve (Fed), also influences the DJIA as it affects the cost of credit, on which many corporations are heavily reliant. Therefore, inflation can be a major driver as well as other metrics which impact the Fed decisions.
Dow Theory is a method for identifying the primary trend of the stock market developed by Charles Dow. A key step is to compare the direction of the Dow Jones Industrial Average (DJIA) and the Dow Jones Transportation Average (DJTA) and only follow trends where both are moving in the same direction. Volume is a confirmatory criteria. The theory uses elements of peak and trough analysis. Dow’s theory posits three trend phases: accumulation, when smart money starts buying or selling; public participation, when the wider public joins in; and distribution, when the smart money exits.
There are a number of ways to trade the DJIA. One is to use ETFs which allow investors to trade the DJIA as a single security, rather than having to buy shares in all 30 constituent companies. A leading example is the SPDR Dow Jones Industrial Average ETF (DIA). DJIA futures contracts enable traders to speculate on the future value of the index and Options provide the right, but not the obligation, to buy or sell the index at a predetermined price in the future. Mutual funds enable investors to buy a share of a diversified portfolio of DJIA stocks thus providing exposure to the overall index.
Author

Joshua Gibson
FXStreet
Joshua joins the FXStreet team as an Economics and Finance double major from Vancouver Island University with twelve years' experience as an independent trader focusing on technical analysis.


