Dow Jones Industrial Average today: Stocks rise as steep downside NFP revisions boost rate cut bets
- Equities tilted higher after steep US hiring revisions further bolstered rate cut bets.
- Rate markets now see nearly a one-in-five chance of a jumbo rate cut next week.
- Despite upbeat stock market reactions, serious economic concerns are growing rapidly.

The Dow Jones Industrial Average (DJIA) tested the high side on Tuesday, bolstered by sharp downward revisions in US job hiring over the past 18 months. Souring labor market data is bolstering investor bets that the Federal Reserve (Fed) will initiate a fresh rate-cutting cycle as the world's largest central bank seeks to bolster the US labor market.
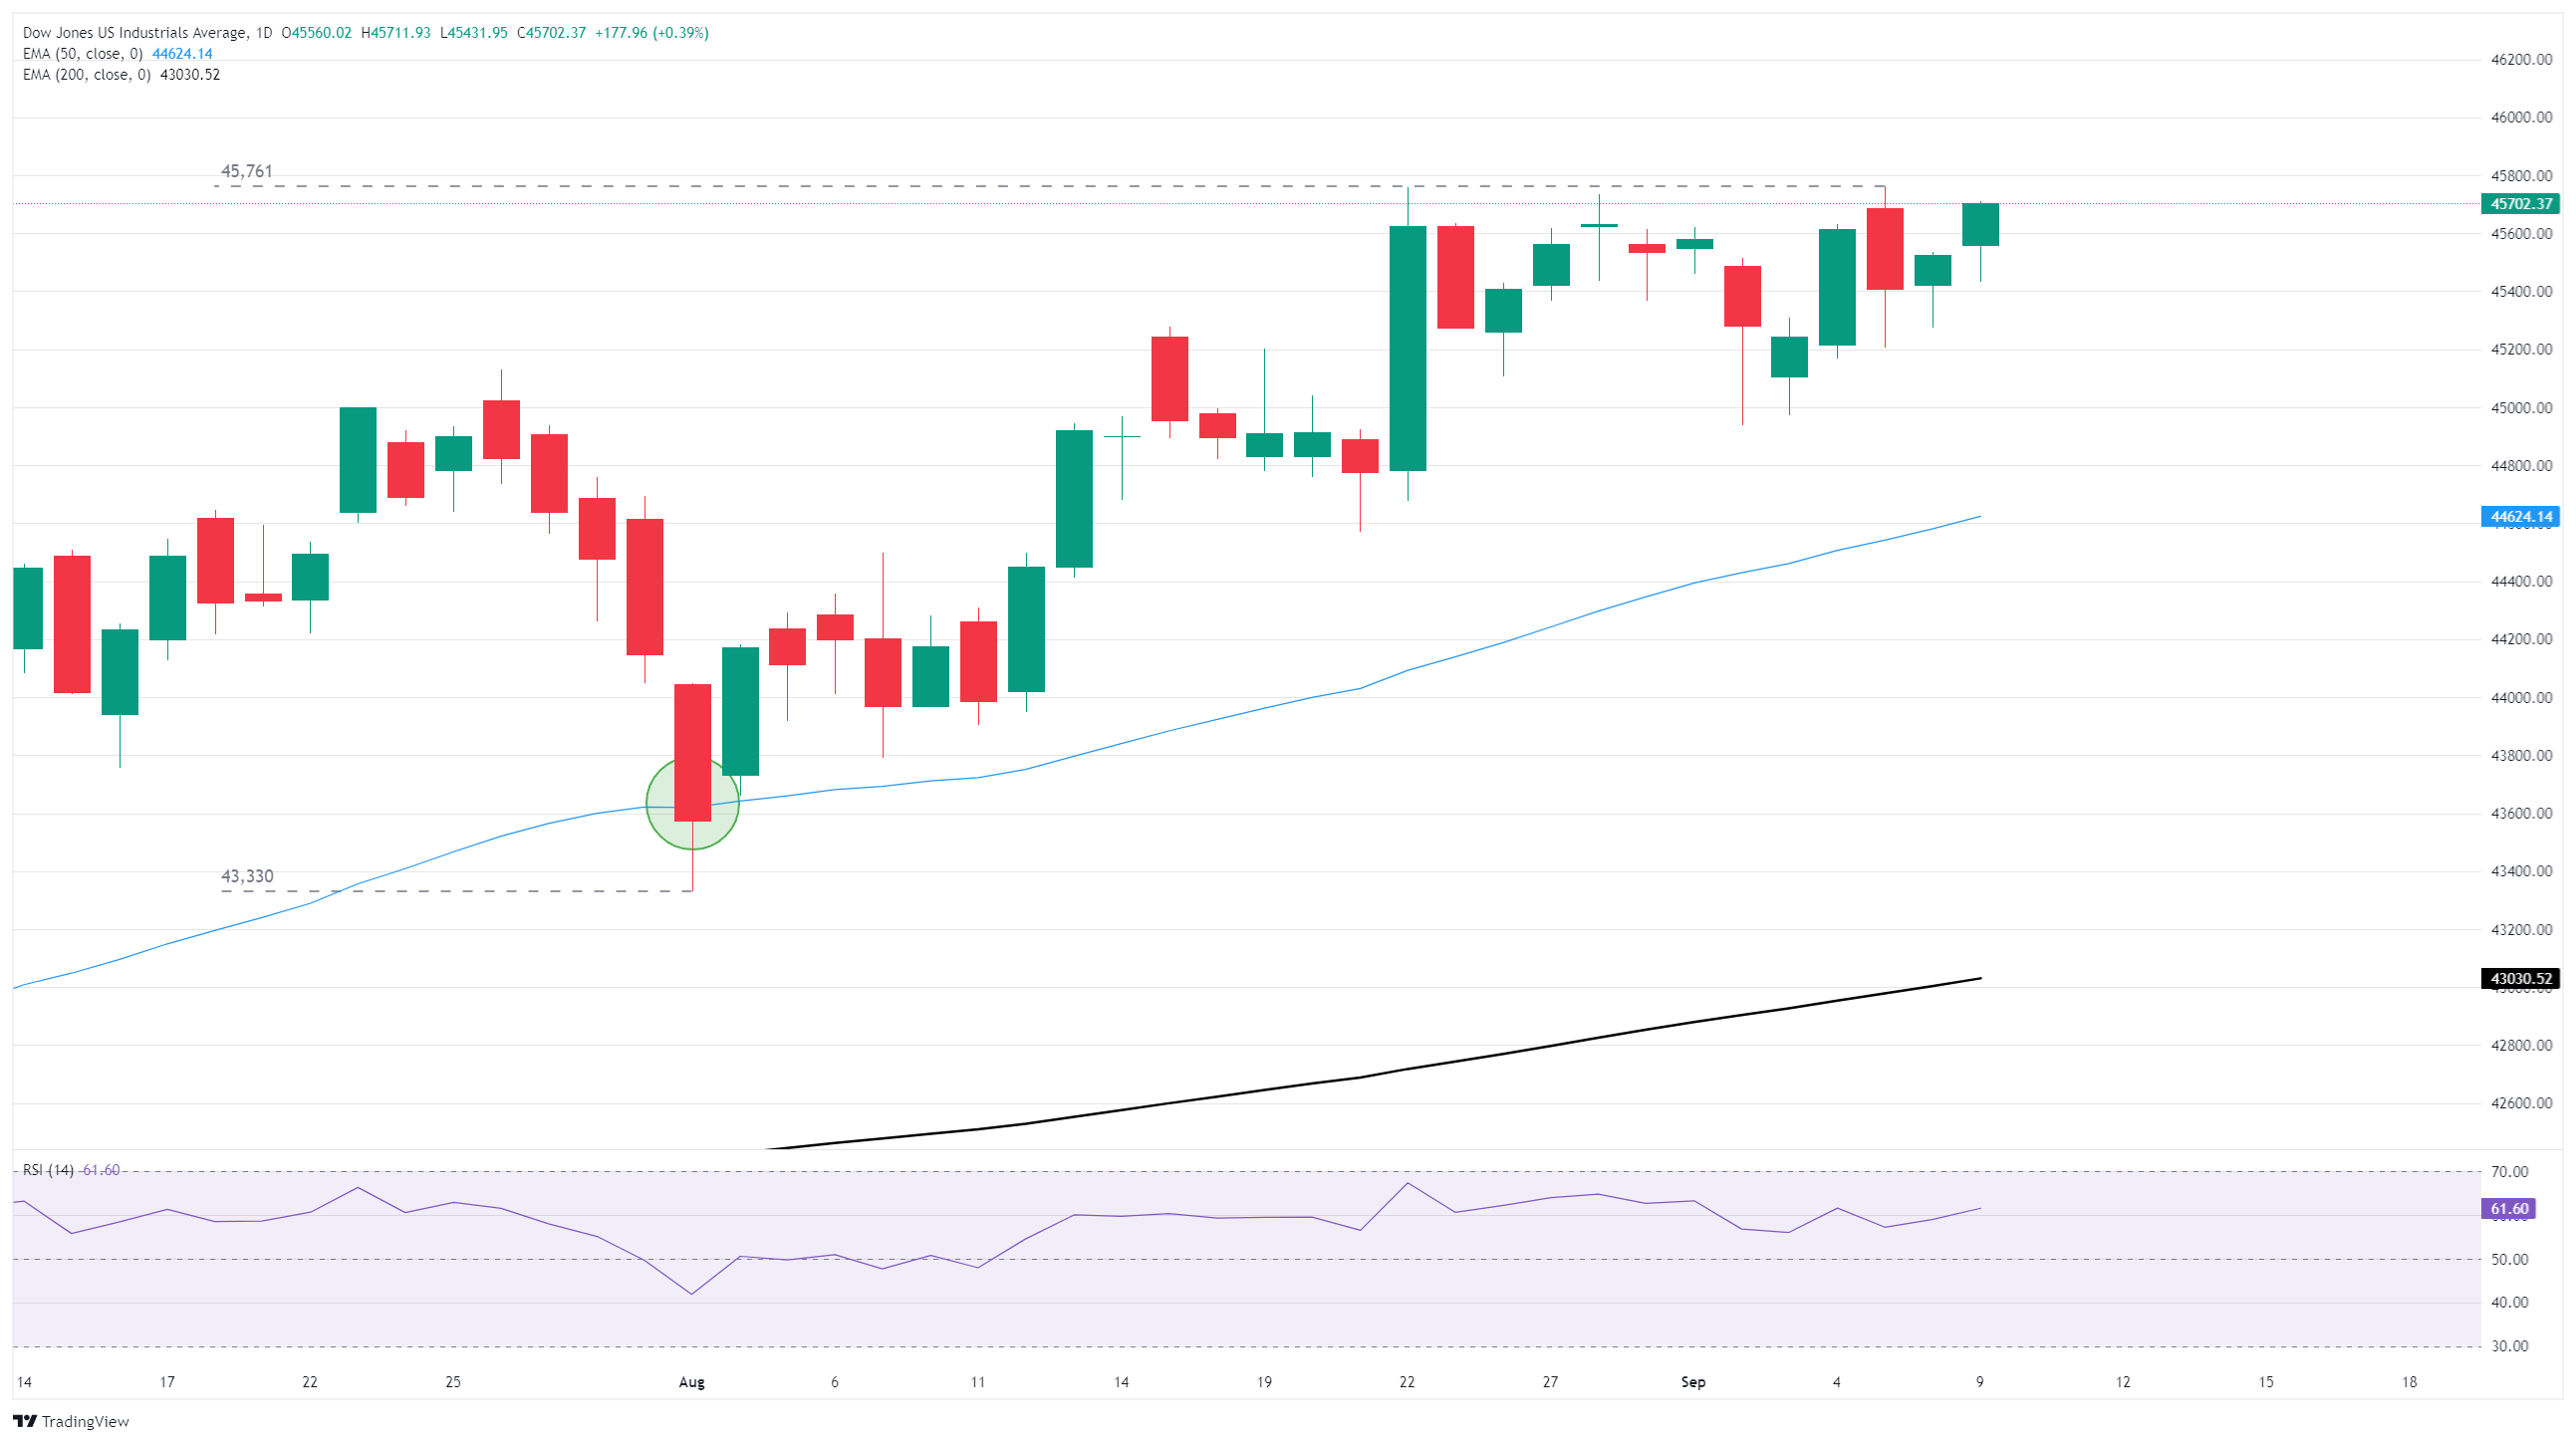
After a brief period of second-guessing, the Dow Jones has risen into the 45,700 region as rate cut hopes bolster sentiment. Equity markets are overall sedate as investors hunker down for the long wait to the Fed’s next rate call on September 17.
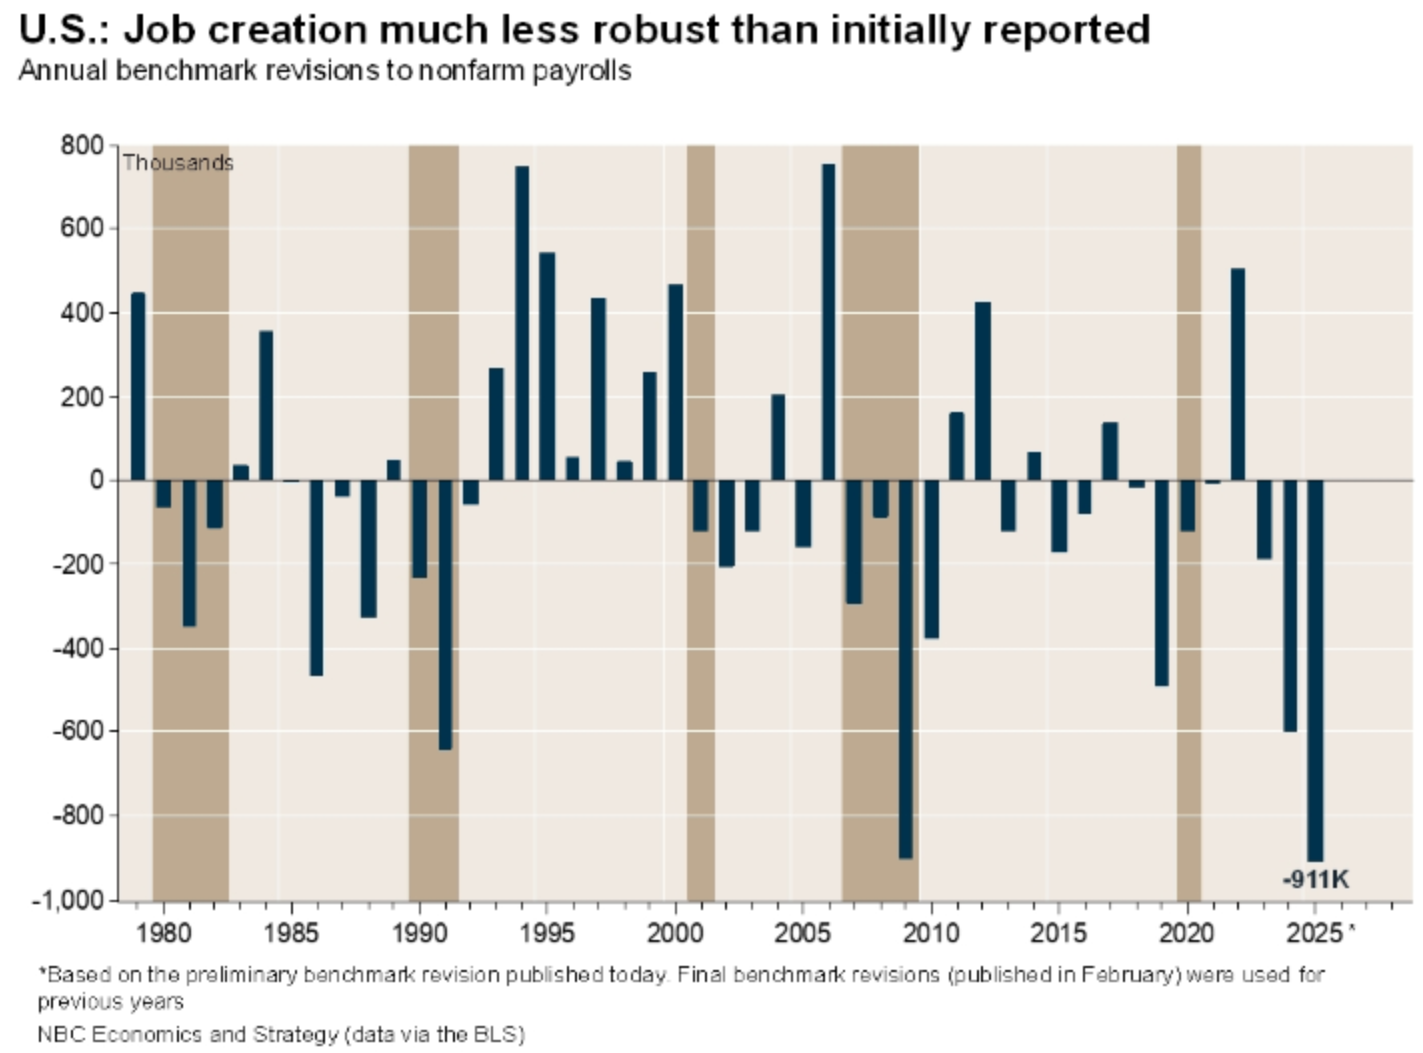
However, markets are growing increasingly concerned that the bottom could be falling out from beneath the US economy. The latest annual adjustment to Nonfarm Payrolls (NFP) showed that the US economy added nearly 900K fewer jobs than previously expected for the March 2024 to March 2025 annual period. Further downside revisions to 2025 employment creation should be expected by data watchers as the current revision window doesn’t include any of the fallout of the post-tariff economy.
Jobs data: deceptively tricky
NFP numbers have taken on significant impact in recent months as the Trump administration moves to politicize the estimation figure. However, deeper accuracy is a difficult ask of a survey sample at a time when the President can cause (or attempt to cause) earth-shifting changes in the business world with the stroke of a pen on a Friday afternoon.
The NFP is an aggregate survey of around 120K private businesses within the US; the response rate frequently changes, and any businesses that cease operations within the response window are simply marked as non-respondents.
The Bureau of Labor Statistics (BLS) uses the Quarterly Census of Employment and Wages (QCEW) to do a large-scale adjustment to NFP data once per year. This data represents 95% of the business operators within the US and is a more accurate measure of labor, as it includes businesses that have either ceased operations or gone out of business. Even now, the “final” benchmark revision for the current review period isn’t expected until next February.
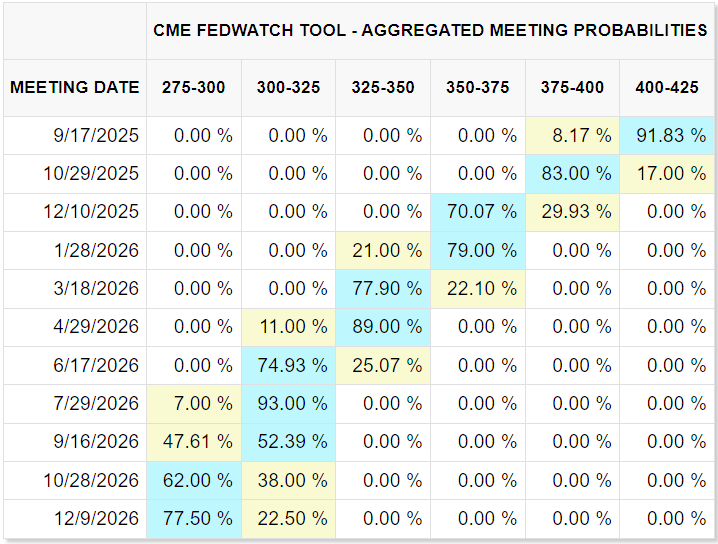
According to the CME’s FedWatch Tool, rate markets have assumed a 25 bps interest rate cut on September 17 is now a foregone conclusion. Some particularly cut-happy rate traders are also pricing in over 17% odds that the Fed will get bullied, either by data or political pressure, into delivering a 50 bps rate cut next week.
While steep downside revisions to labor data is a concern, and points to a US economy that is in a much worse place than many had assumed through the first three quarters of the year, odds of the Fed accelerating interest rate cuts remain slim, albeit not entirely zero.
The latest batch of US Consumer Price Index (CPI) inflation, due on Thursday, is expected to show that inflationary price pressure is still coasting well above the Fed’s 2% annual target. This makes it difficult for the Fed to deliver interest rate cuts at too fast of a pitch, regardless of how far policy rates may or may not be above r-star, or the natural rate of interest.
Read more stock news: UnitedHealth stock rises to four-month high. Is the recovery here?
Dow Jones daily chart
Dow Jones FAQs
The Dow Jones Industrial Average, one of the oldest stock market indices in the world, is compiled of the 30 most traded stocks in the US. The index is price-weighted rather than weighted by capitalization. It is calculated by summing the prices of the constituent stocks and dividing them by a factor, currently 0.152. The index was founded by Charles Dow, who also founded the Wall Street Journal. In later years it has been criticized for not being broadly representative enough because it only tracks 30 conglomerates, unlike broader indices such as the S&P 500.
Many different factors drive the Dow Jones Industrial Average (DJIA). The aggregate performance of the component companies revealed in quarterly company earnings reports is the main one. US and global macroeconomic data also contributes as it impacts on investor sentiment. The level of interest rates, set by the Federal Reserve (Fed), also influences the DJIA as it affects the cost of credit, on which many corporations are heavily reliant. Therefore, inflation can be a major driver as well as other metrics which impact the Fed decisions.
Dow Theory is a method for identifying the primary trend of the stock market developed by Charles Dow. A key step is to compare the direction of the Dow Jones Industrial Average (DJIA) and the Dow Jones Transportation Average (DJTA) and only follow trends where both are moving in the same direction. Volume is a confirmatory criteria. The theory uses elements of peak and trough analysis. Dow’s theory posits three trend phases: accumulation, when smart money starts buying or selling; public participation, when the wider public joins in; and distribution, when the smart money exits.
There are a number of ways to trade the DJIA. One is to use ETFs which allow investors to trade the DJIA as a single security, rather than having to buy shares in all 30 constituent companies. A leading example is the SPDR Dow Jones Industrial Average ETF (DIA). DJIA futures contracts enable traders to speculate on the future value of the index and Options provide the right, but not the obligation, to buy or sell the index at a predetermined price in the future. Mutual funds enable investors to buy a share of a diversified portfolio of DJIA stocks thus providing exposure to the overall index.
Author

Joshua Gibson
FXStreet
Joshua joins the FXStreet team as an Economics and Finance double major from Vancouver Island University with twelve years' experience as an independent trader focusing on technical analysis.