Dow Jones Industrial Average falls over 700 points on Friday
- The Dow Jones fell 1.6% to 43,4500 on Friday.
- US PMIs came in mixed, consumer sentiment fell, inflation expectations accelerated.
- UnitedHealth is reported to be under investigation by the US Justice Department.

The Dow Jones Industrial Average (DJIA) backslid over 700 points on Friday, knocking lower around one and a half percent and touching the 43,500 level for the first time in over a month. US economic data broadly came in mixed to bearish, but key losses are piling onto single-target stocks, dragging the Dow Jones significantly lower.
Possible recession fears are back on the table after a sharp turnaround in US Purchasing Managers Index (PMI) figures. The Services PMI component fell to 49.7, its lowest print in exactly two years. With the Services PMI falling below the 50.0 mark and back into contraction territory, the Manufacturing PMI component’s own sluggish uptick helped keep things on balance, but not by much. The Manufacturing PMI rose to 51.6 from 51.2, reaching a seven-month high.
The University of Michigan’s (UoM) Consumer Sentiment Index also fell sharply in January, hitting a 15-month low of 64.7, as inflation concerns weighed on consumer sentiment. The UoM 12-month Consumer Inflation Expectations shows that a sample of US consumers now expect inflation to be 4.3% over the next year, and the 5-year outlook also accelerated to 3.5%. With consumer inflation expectations rising, it will be harder for the Federal Reserve (Fed) to deliver rate cuts.
Dow Jones news
Roughly half of the Dow Jones equity board is in the green on Friday, but steep declines in UnitedHealth (UNH) are pummeling the Dow’s headline bids. UnitedHealth is down 9% on the day, falling to $458 per share after it was revealed the healthcare giant is set to be investigated by the US Justice Department.
Dow Jones price forecast
With one hard bearish push, the Dow Jones is now trading into the dead zone between the 50-day and 200-day Exponential Moving Averages (EMA) at 43,945 and 41,970, respectively. Price action has turned sharply bearish, but there is still plenty of room for a sharp pullback into the high side.
A hard ceiling has been priced in near the 45,00 handle, and bidders will likely begin to pile back into the chart as prices continue to decline toward 43,000.
Dow Jones daily chart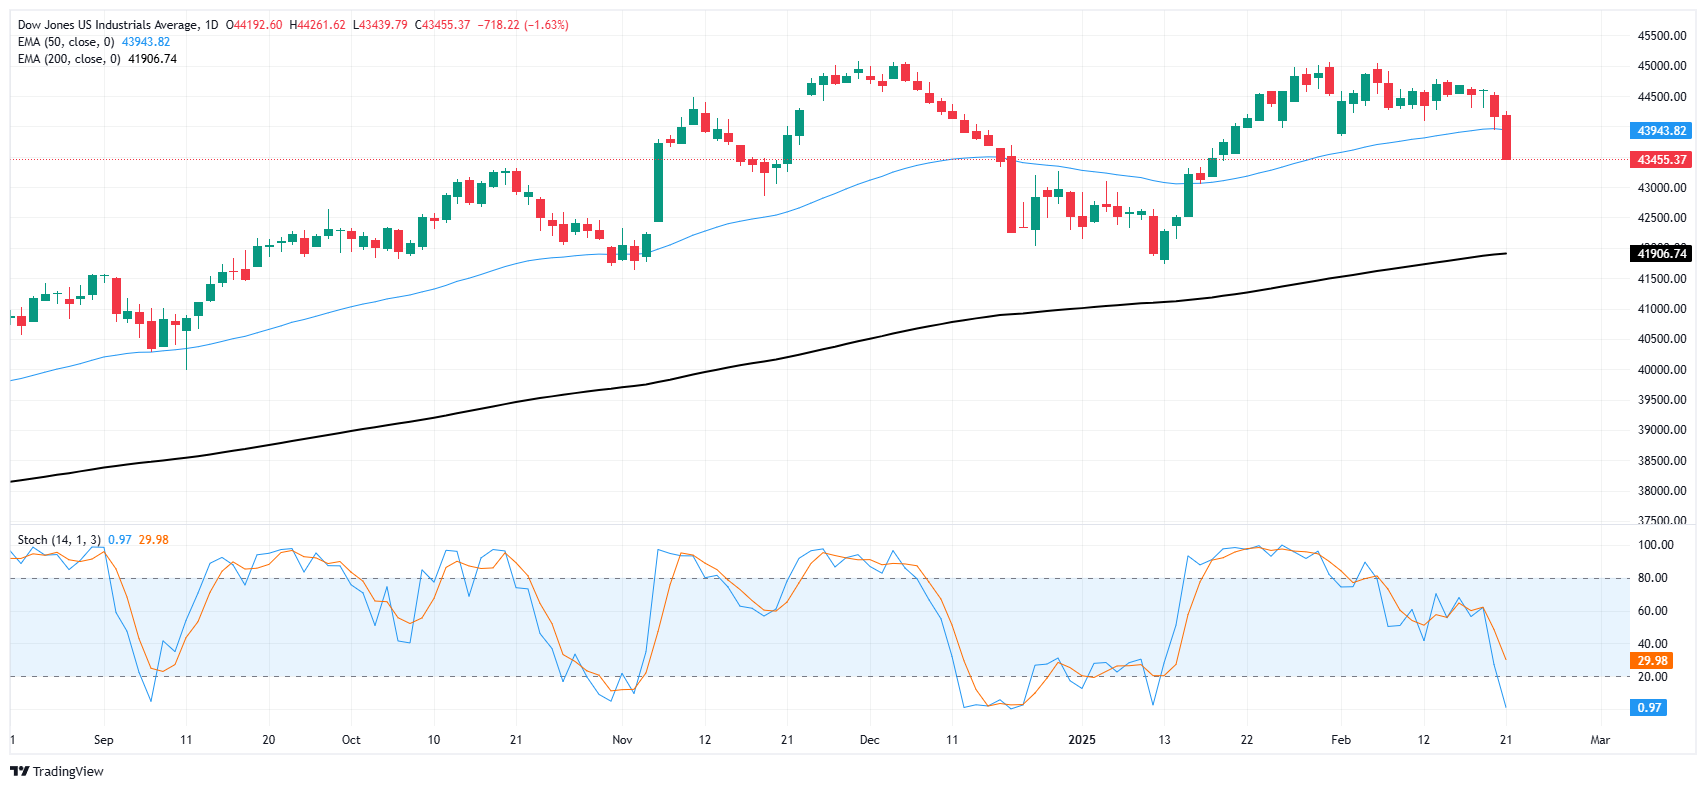
Dow Jones FAQs
The Dow Jones Industrial Average, one of the oldest stock market indices in the world, is compiled of the 30 most traded stocks in the US. The index is price-weighted rather than weighted by capitalization. It is calculated by summing the prices of the constituent stocks and dividing them by a factor, currently 0.152. The index was founded by Charles Dow, who also founded the Wall Street Journal. In later years it has been criticized for not being broadly representative enough because it only tracks 30 conglomerates, unlike broader indices such as the S&P 500.
Many different factors drive the Dow Jones Industrial Average (DJIA). The aggregate performance of the component companies revealed in quarterly company earnings reports is the main one. US and global macroeconomic data also contributes as it impacts on investor sentiment. The level of interest rates, set by the Federal Reserve (Fed), also influences the DJIA as it affects the cost of credit, on which many corporations are heavily reliant. Therefore, inflation can be a major driver as well as other metrics which impact the Fed decisions.
Dow Theory is a method for identifying the primary trend of the stock market developed by Charles Dow. A key step is to compare the direction of the Dow Jones Industrial Average (DJIA) and the Dow Jones Transportation Average (DJTA) and only follow trends where both are moving in the same direction. Volume is a confirmatory criteria. The theory uses elements of peak and trough analysis. Dow’s theory posits three trend phases: accumulation, when smart money starts buying or selling; public participation, when the wider public joins in; and distribution, when the smart money exits.
There are a number of ways to trade the DJIA. One is to use ETFs which allow investors to trade the DJIA as a single security, rather than having to buy shares in all 30 constituent companies. A leading example is the SPDR Dow Jones Industrial Average ETF (DIA). DJIA futures contracts enable traders to speculate on the future value of the index and Options provide the right, but not the obligation, to buy or sell the index at a predetermined price in the future. Mutual funds enable investors to buy a share of a diversified portfolio of DJIA stocks thus providing exposure to the overall index.
Author

Joshua Gibson
FXStreet
Joshua joins the FXStreet team as an Economics and Finance double major from Vancouver Island University with twelve years' experience as an independent trader focusing on technical analysis.


