Dow Jones Industrial Average gets hammered by new Trump tariff threats
- The Dow Jones tumbled on Monday, falling back below 44,500.
- President Trump has pivoted on tariffs yet again, kicking the can on self-imposed deadlines.
- Despite waffling on the July 9 trade deadline, the Trump administration is back with fresh tariff threats.

The Dow Jones Industrial Average (DJIA) sank on Monday, falling back below key technical levels. The Trump administration added fresh tariff threats against key US trading partners to paper over another delay of previously imposed tariffs, sparking a new bout of risk aversion among investors who are growing weary of riding the whiplash tariff roller coaster.
Tariff buildup deepens despite another delay
The July 9 deadline for President Trump’s reciprocal tariffs, originally announced and delayed in early April, has now been pushed to the beginning of August as the Trump administration struggles to secure advantageous trade concessions from the rest of the planet. Outside of some preliminary agreements with China and the United Kingdom, and a small-scale trade arrangement with Vietnam, very little progress has been made on the Trump team’s mandate to squeeze trade deals out of 90 countries in 90 days.
Donald Trump announced the delivery of trade demand letters to countries including South Korea and Japan, warning that he intends to impose an additional 25% tariff on all US imports from both countries beginning on August 1 if they don’t play ball on trade negotiations. US Commerce Secretary Howard Lutnick also announced on Sunday that the Trump administration would be having a busy week, cautioning that several trade announcements would be made in the coming days. Commerce Secretary Lutnick opted not to reveal the names of any specific countries the US is close to inking trade deals on, a pattern that has repeated itself on a weekly basis since April.
Read more stock news: US stocks open lower as Trump threatens additional tariffs on BRICS nations
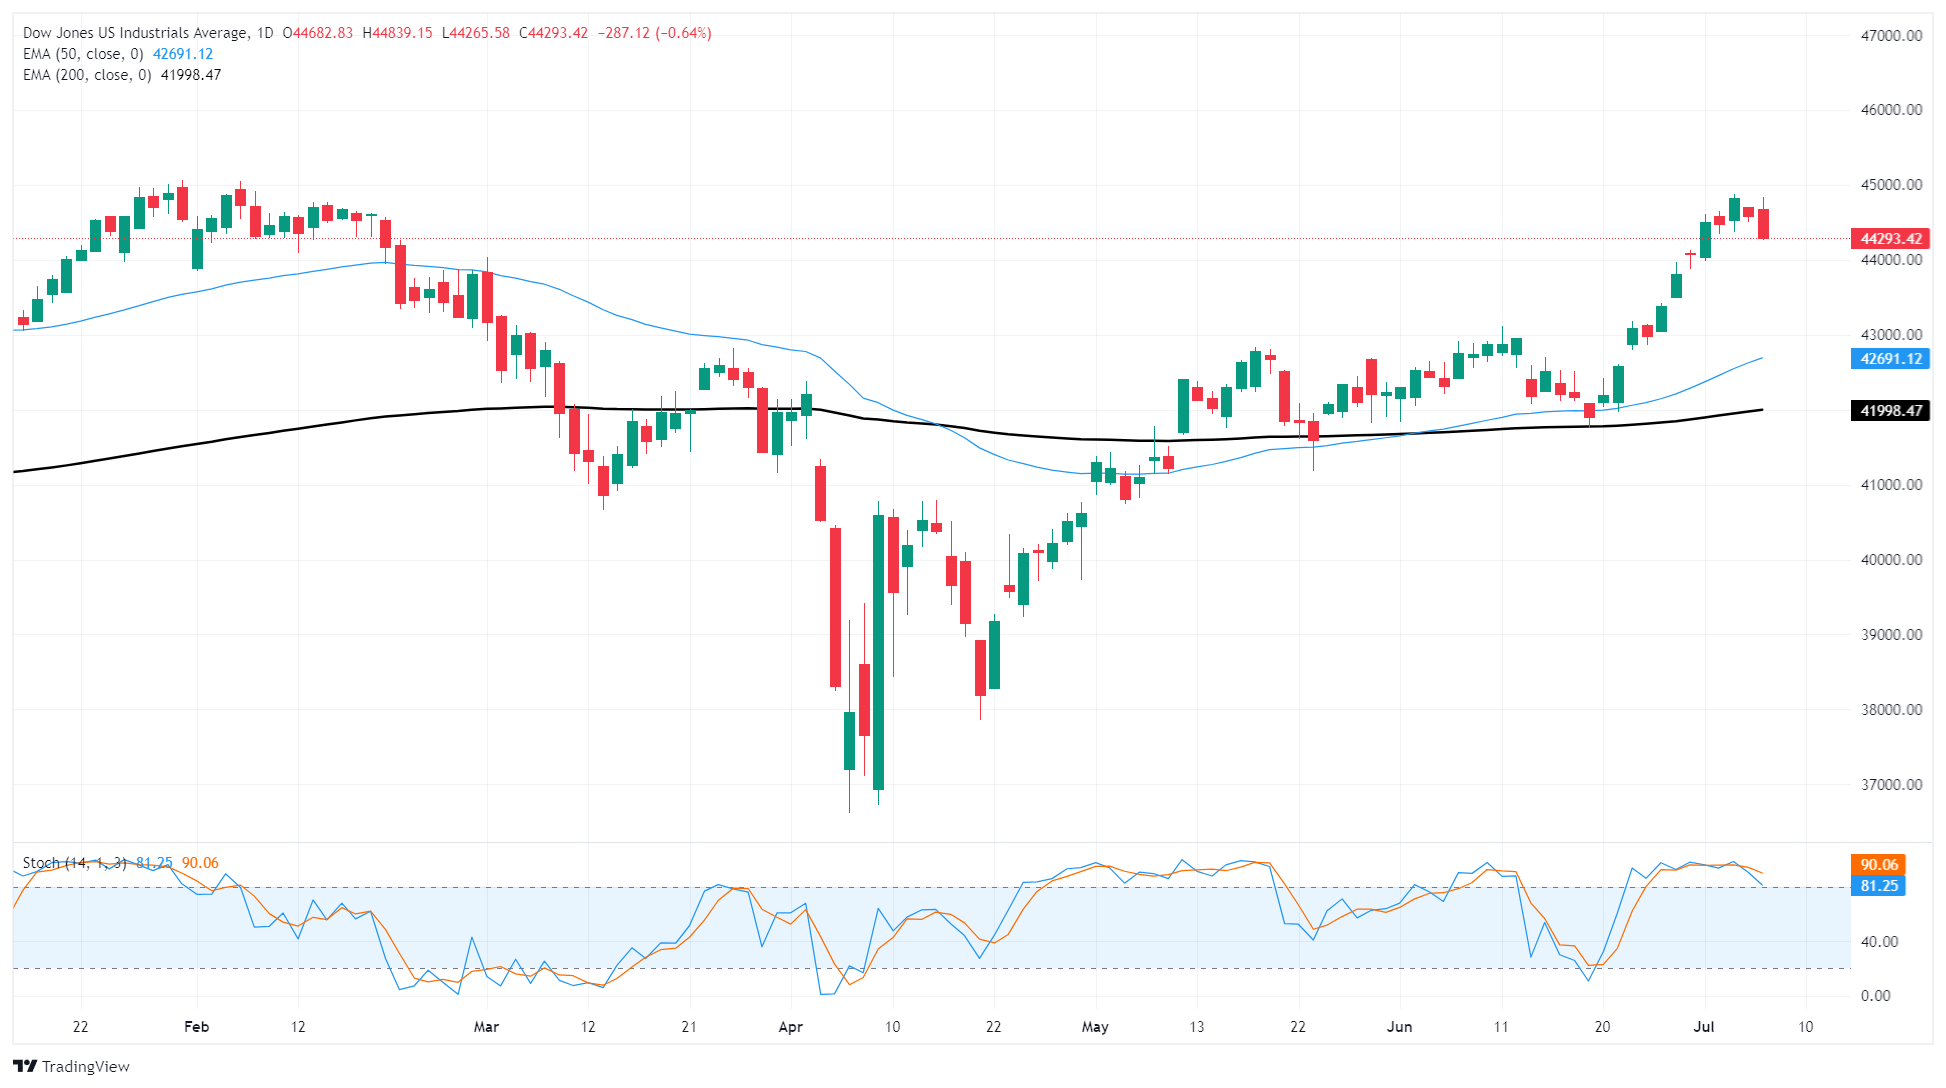
Dow Jones price forecast
The Dow Jones’s backslide on Monday has dragged the major equity index back below 44,500 following a multi-week grind back above the key technical level. The Dow Jones is still holding on the high side of the 44,000 handle, and price action is still tilted firmly into the bullish side despite a near-term pullback.
The Dow is still up 21% from April’s post-tariff bottom near 36,600, and the next technical target is new all-time highs above 45,000. On the low side, near-term technical support is priced in at the 50-day Exponential Moving Average (EMA) parked just below 43,000.
Dow Jones daily chart
Dow Jones FAQs
The Dow Jones Industrial Average, one of the oldest stock market indices in the world, is compiled of the 30 most traded stocks in the US. The index is price-weighted rather than weighted by capitalization. It is calculated by summing the prices of the constituent stocks and dividing them by a factor, currently 0.152. The index was founded by Charles Dow, who also founded the Wall Street Journal. In later years it has been criticized for not being broadly representative enough because it only tracks 30 conglomerates, unlike broader indices such as the S&P 500.
Many different factors drive the Dow Jones Industrial Average (DJIA). The aggregate performance of the component companies revealed in quarterly company earnings reports is the main one. US and global macroeconomic data also contributes as it impacts on investor sentiment. The level of interest rates, set by the Federal Reserve (Fed), also influences the DJIA as it affects the cost of credit, on which many corporations are heavily reliant. Therefore, inflation can be a major driver as well as other metrics which impact the Fed decisions.
Dow Theory is a method for identifying the primary trend of the stock market developed by Charles Dow. A key step is to compare the direction of the Dow Jones Industrial Average (DJIA) and the Dow Jones Transportation Average (DJTA) and only follow trends where both are moving in the same direction. Volume is a confirmatory criteria. The theory uses elements of peak and trough analysis. Dow’s theory posits three trend phases: accumulation, when smart money starts buying or selling; public participation, when the wider public joins in; and distribution, when the smart money exits.
There are a number of ways to trade the DJIA. One is to use ETFs which allow investors to trade the DJIA as a single security, rather than having to buy shares in all 30 constituent companies. A leading example is the SPDR Dow Jones Industrial Average ETF (DIA). DJIA futures contracts enable traders to speculate on the future value of the index and Options provide the right, but not the obligation, to buy or sell the index at a predetermined price in the future. Mutual funds enable investors to buy a share of a diversified portfolio of DJIA stocks thus providing exposure to the overall index.
Author

Joshua Gibson
FXStreet
Joshua joins the FXStreet team as an Economics and Finance double major from Vancouver Island University with twelve years' experience as an independent trader focusing on technical analysis.


