Dow Jones Industrial Average taps new record high, closes just below 45,000
- The Dow Jones finds room to move higher on thin Friday.
- November set to close as the Dow Jones’ best-performing month of the year.
- Another data-laden NFP week looms ahead over the horizon.

The Dow Jones Industrial Average (DJIA) explored territory north of the 45,000 handle for the second time this week. With little on the data docket and Friday’s Post-Thanksgiving holiday trading hours cut short, investors scrambled to push equities into record territory before closing up shop for the weekend. Despite a firm bid into record territory, investors fell just short of pushing the Dow Jones into a close above 45,000, wrapping up the trading week just below the key figure.
Tech stocks, specifically chipmakers, are helping to bolster stock indexes after it was revealed that additional restrictions on the sale of semiconductor goods to China being considered by the Biden administration may not be as stiff as many investors had originally feared. Lacking any other fundamental reasons to sell short, traders are bidding stocks higher for the day as markets continue to brush off renewed threats of wide-reaching tariffs set to be imposed by incoming President-elect Donald Trump in January.
Next week will see a fresh round of employment and labor figures that will draw eyes from all corners of the market. This will culminate in another print of monthly Nonfarm Payrolls (NFP) numbers next Friday.
Dow Jones news
Equities broadly found higher ground on holiday-shortened Friday, with two-thirds of the Dow Jones printing in the green from the day’s opening bids at the closing bell. Nvidia (NVDA) rallied over 2%, closing north of $138 per share as the chipmaker recovers from a recent downturn. Investors soured on NVDA after it was revealed that the major tech sector player, which is expected to see revenues soar by another 100% YoY in 2025, may see extended gross inflows shrink to a paltry 50% YoY in 2026. NVDA has fallen over 7% from its all-time high of $148.88 set earlier this month, but still up over 1,000% from 2022’s lows near $12.
Dow Jones price forecast
The DJIA continues to find higher ground, vexing traders looking to amass short positions as price action shows little disregard for any precise definition of overbought conditions. The Dow Jones is up nearly 20% YTD, and has closed in the green for all but two of the last 11 consecutive months.
Traders looking to get into an exhaustion play will be looking for an eventual decline to the 50-day Exponential Moving Average (EMA) rising through 43,000, but a long-running pattern of bouncing from the key moving average means they should just get out of the way and follow the crowd into a fresh leg higher.
Dow Jones daily chart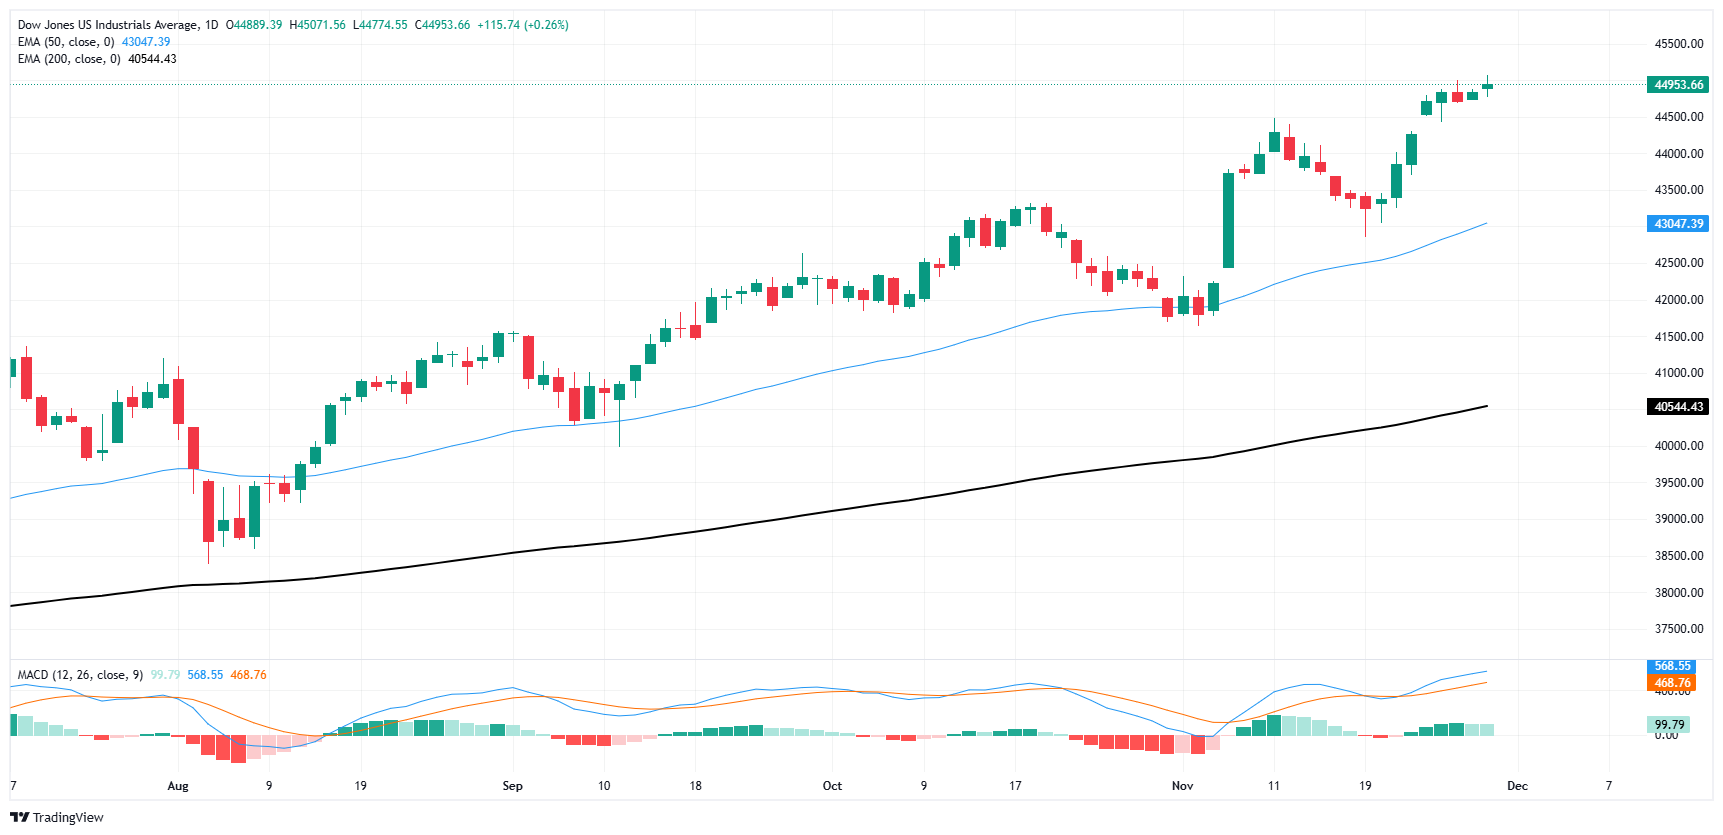
Dow Jones FAQs
The Dow Jones Industrial Average, one of the oldest stock market indices in the world, is compiled of the 30 most traded stocks in the US. The index is price-weighted rather than weighted by capitalization. It is calculated by summing the prices of the constituent stocks and dividing them by a factor, currently 0.152. The index was founded by Charles Dow, who also founded the Wall Street Journal. In later years it has been criticized for not being broadly representative enough because it only tracks 30 conglomerates, unlike broader indices such as the S&P 500.
Many different factors drive the Dow Jones Industrial Average (DJIA). The aggregate performance of the component companies revealed in quarterly company earnings reports is the main one. US and global macroeconomic data also contributes as it impacts on investor sentiment. The level of interest rates, set by the Federal Reserve (Fed), also influences the DJIA as it affects the cost of credit, on which many corporations are heavily reliant. Therefore, inflation can be a major driver as well as other metrics which impact the Fed decisions.
Dow Theory is a method for identifying the primary trend of the stock market developed by Charles Dow. A key step is to compare the direction of the Dow Jones Industrial Average (DJIA) and the Dow Jones Transportation Average (DJTA) and only follow trends where both are moving in the same direction. Volume is a confirmatory criteria. The theory uses elements of peak and trough analysis. Dow’s theory posits three trend phases: accumulation, when smart money starts buying or selling; public participation, when the wider public joins in; and distribution, when the smart money exits.
There are a number of ways to trade the DJIA. One is to use ETFs which allow investors to trade the DJIA as a single security, rather than having to buy shares in all 30 constituent companies. A leading example is the SPDR Dow Jones Industrial Average ETF (DIA). DJIA futures contracts enable traders to speculate on the future value of the index and Options provide the right, but not the obligation, to buy or sell the index at a predetermined price in the future. Mutual funds enable investors to buy a share of a diversified portfolio of DJIA stocks thus providing exposure to the overall index.
Economic Indicator
Nonfarm Payrolls
The Nonfarm Payrolls release presents the number of new jobs created in the US during the previous month in all non-agricultural businesses; it is released by the US Bureau of Labor Statistics (BLS). The monthly changes in payrolls can be extremely volatile. The number is also subject to strong reviews, which can also trigger volatility in the Forex board. Generally speaking, a high reading is seen as bullish for the US Dollar (USD), while a low reading is seen as bearish, although previous months' reviews and the Unemployment Rate are as relevant as the headline figure. The market's reaction, therefore, depends on how the market assesses all the data contained in the BLS report as a whole.
Read more.Next release: Fri Dec 06, 2024 13:30
Frequency: Monthly
Consensus: 183K
Previous: 12K
Source: US Bureau of Labor Statistics
America’s monthly jobs report is considered the most important economic indicator for forex traders. Released on the first Friday following the reported month, the change in the number of positions is closely correlated with the overall performance of the economy and is monitored by policymakers. Full employment is one of the Federal Reserve’s mandates and it considers developments in the labor market when setting its policies, thus impacting currencies. Despite several leading indicators shaping estimates, Nonfarm Payrolls tend to surprise markets and trigger substantial volatility. Actual figures beating the consensus tend to be USD bullish.
Author

Joshua Gibson
FXStreet
Joshua joins the FXStreet team as an Economics and Finance double major from Vancouver Island University with twelve years' experience as an independent trader focusing on technical analysis.


