Dow Jones Industrial Average slows advance as investors await good news
- The Dow Jones remains stuck near 42,500 on Tuesday.
- Equities blinked after another sharp downturn in CB consumer expectations.
- Investors remain leery of slowing economic data and a potential uptick in inflation.

The Dow Jones Industrial Average (DJIA) stuck in place on Tuesday, adrift near the 42,500 level after a another sharp decline in CB Consumer Confidence survey results broke a near-term bullish recovery in stock prices. Sentiment surveys continue to get weighed down by policy and tariff uncertainty, keeping risk appetite tepid as investors await signs or stability in both economic conditions and US trade policy.
According to the US Conference Board (CB), one-year consumer inflation expectations have risen yet again, rising to 6.2% in March versus February’s 5.8%. According to the CB, consumers remain overwhelmingly concerned about the still-high price of staple household goods like eggs, and overarching concerns about potential inflation fallout from the Trump administration’s tariffs. The CB’s consumer confidence survey of future economic expectations also dropped to a new 12-year low on March, falling to 65.2 and tumbling well below the 80.0 mark that typically forecasts a possible recession.
Adding insult to injury, the Moody’s ratings agency released a noted early Tuesday warning that the US’s fiscal strength has “deteriorated”, specifically highlighting the increasing unaffordability of US debt servicing. Going further, Moody’s noted that US fiscal strength is heading for a multi-year decline, a statement that is likely to anger Donald Trump and his administration, who are actively pursuing a large debt limit increase from Congress.
Stocks news
Despite a raft of cautionary data and notes on Tuesday, investor sentiment remains relatively stable heading into the middle of the trading week. The Dow Jones remains stubbornly stuck to the 42,500 region, and the Standard & Poor’s 500 (S&P) index was also flat, treading water near 5,760. The Nasdaq Composite index rose around one-quarter of one percent to 18,230 as tech stocks recover their footing, but not enough to drag the rest of the equity market higher.
Read more stock news: Apple stock rises as Nvidia sheds weight
Dow Jones price forecast
The Dow Jones Industrial Average has run out of gas in the near term, with intraday bids stuck to the 42,500 level. Price action still leans in favor of buyers after the DJIA recovered back to the top side of the 200-day Exponential Moving Average (EMA) near the 42,000 major price handle, but bidders may be poised to take a breather.
Technical oscillators show bulls still have some room to run, but its a steep climb to recover record highs north of 45,000. On the low end, a backslide could mean an extended decline back below the latest swing low into 40,660.
Dow Jones 5-minute chart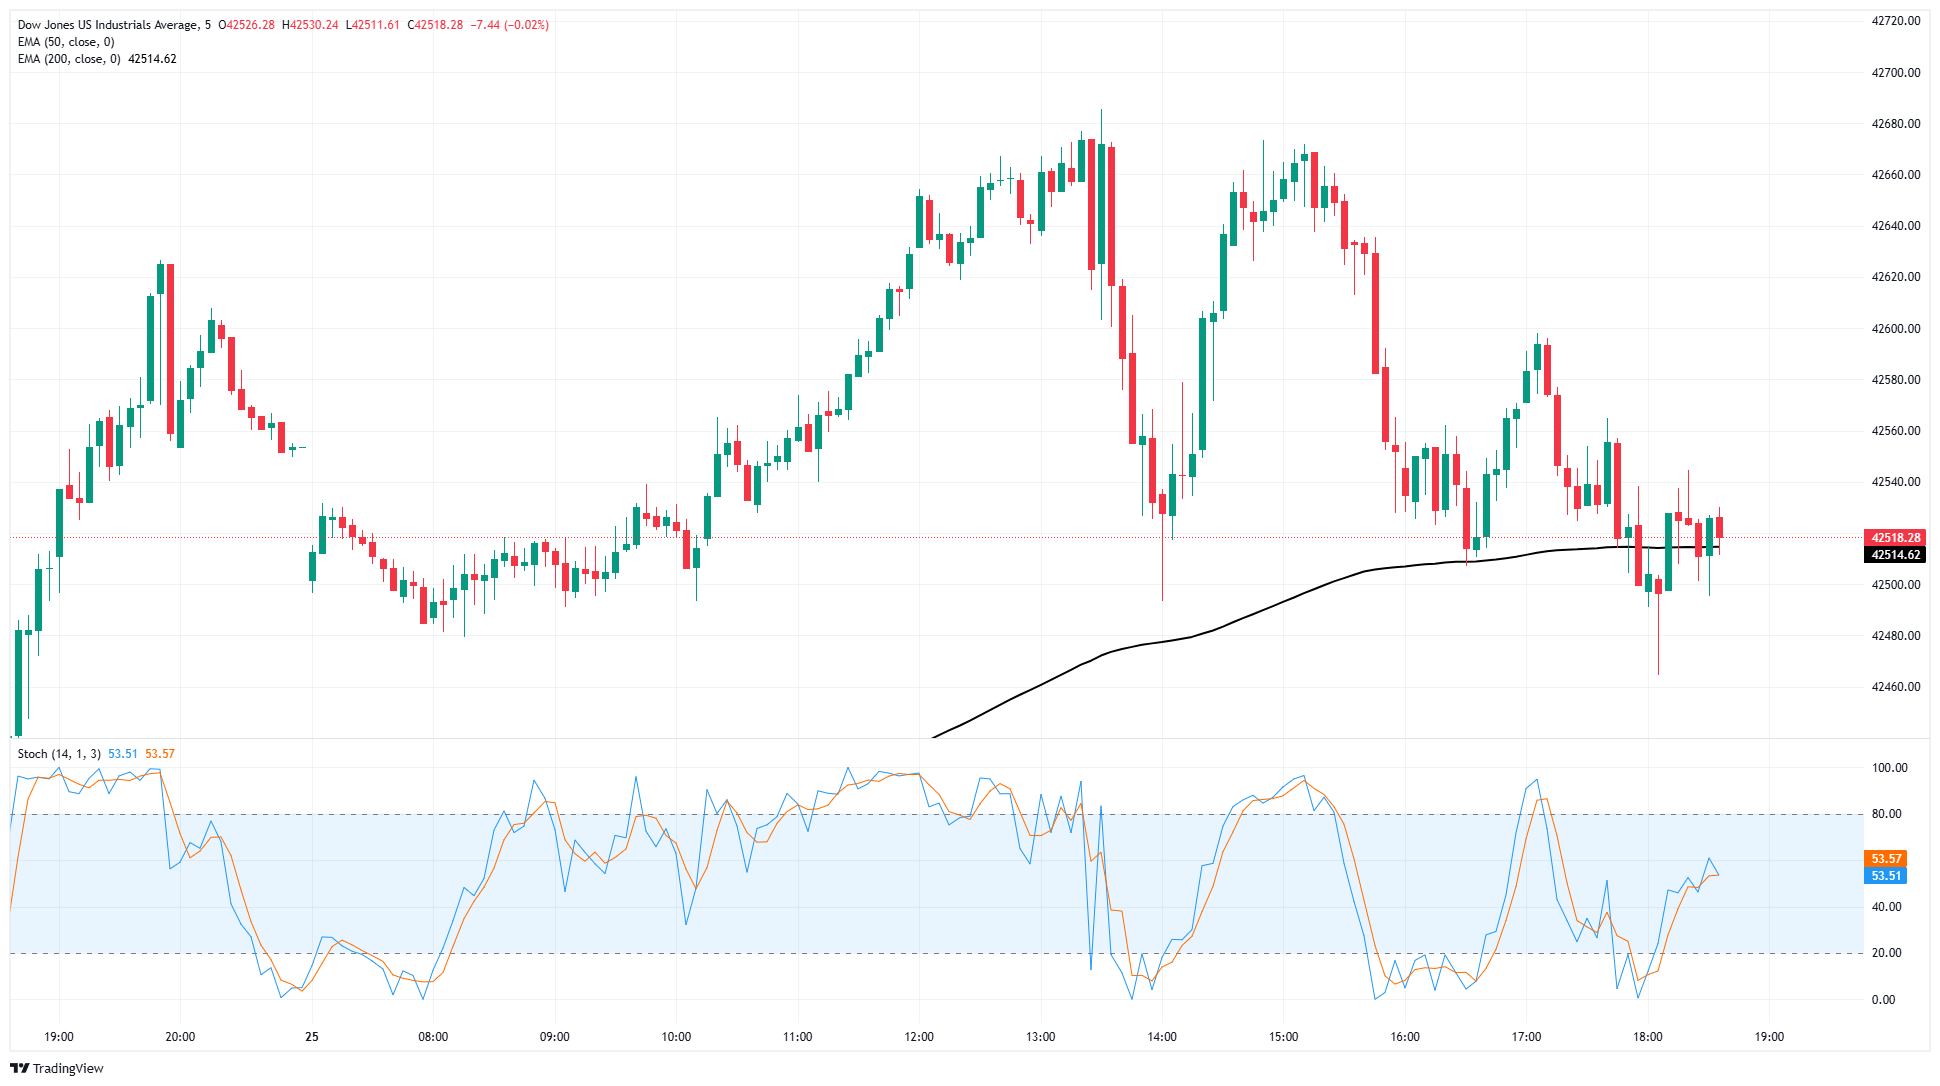
Dow Jones daily chart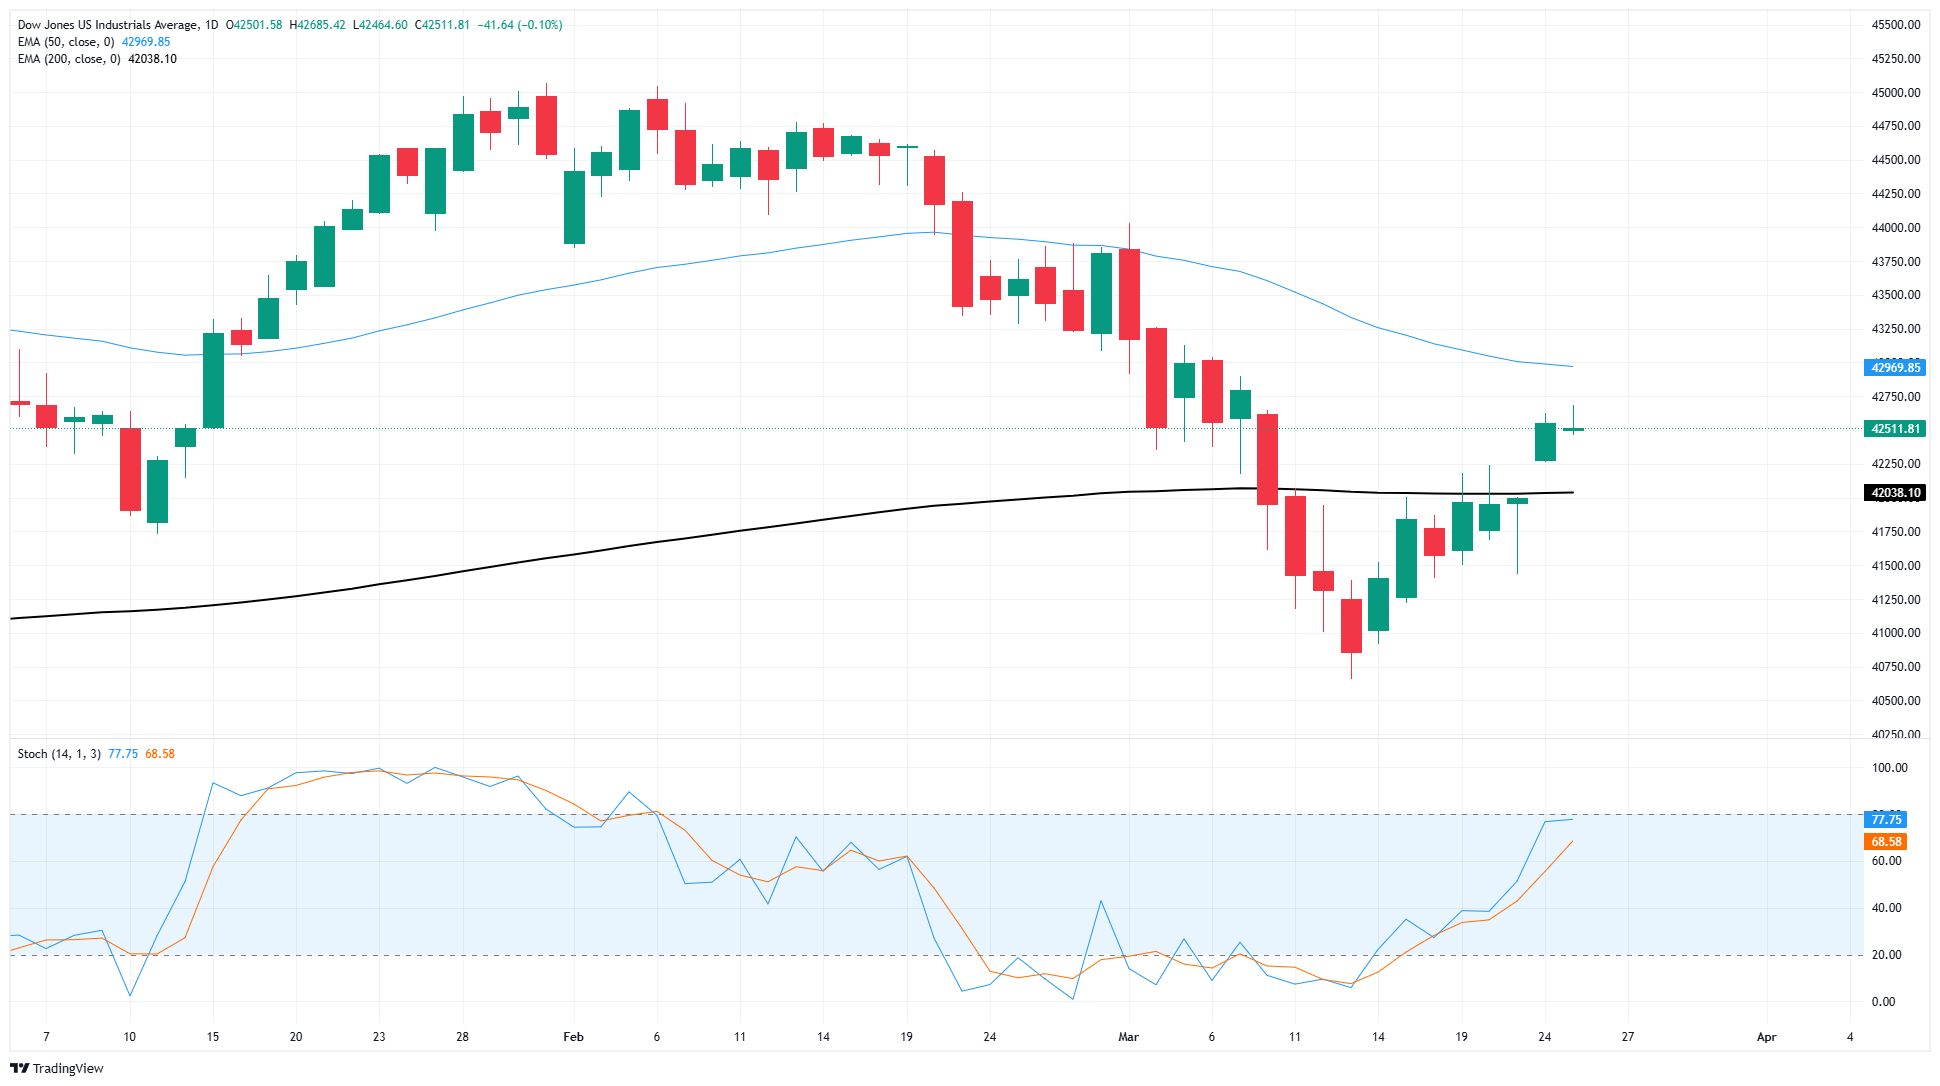
S&P 500 FAQs
The S&P 500 is a widely followed stock price index which measures the performance of 500 publicly owned companies, and is seen as a broad measure of the US stock market. Each company’s influence on the computation of the index is weighted based on market capitalization. This is calculated by multiplying the number of publicly traded shares of the company by the share price. The S&P 500 index has achieved impressive returns – $1.00 invested in 1970 would have yielded a return of almost $192.00 in 2022. The average annual return since its inception in 1957 has been 11.9%.
Companies are selected by committee, unlike some other indexes where they are included based on set rules. Still, they must meet certain eligibility criteria, the most important of which is market capitalization, which must be greater than or equal to $12.7 billion. Other criteria include liquidity, domicile, public float, sector, financial viability, length of time publicly traded, and representation of the industries in the economy of the United States. The nine largest companies in the index account for 27.8% of the market capitalization of the index.
There are a number of ways to trade the S&P 500. Most retail brokers and spread betting platforms allow traders to use Contracts for Difference (CFD) to place bets on the direction of the price. In addition, that can buy into Index, Mutual and Exchange Traded Funds (ETF) that track the price of the S&P 500. The most liquid of the ETFs is State Street Corporation’s SPY. The Chicago Mercantile Exchange (CME) offers futures contracts in the index and the Chicago Board of Options (CMOE) offers options as well as ETFs, inverse ETFs and leveraged ETFs.
Many different factors drive the S&P 500 but mainly it is the aggregate performance of the component companies revealed in their quarterly and annual company earnings reports. US and global macroeconomic data also contributes as it impacts on investor sentiment, which if positive drives gains. The level of interest rates, set by the Federal Reserve (Fed), also influences the S&P 500 as it affects the cost of credit, on which many corporations are heavily reliant. Therefore, inflation can be a major driver as well as other metrics which impact the Fed decisions.
Author

Joshua Gibson
FXStreet
Joshua joins the FXStreet team as an Economics and Finance double major from Vancouver Island University with twelve years' experience as an independent trader focusing on technical analysis.


