Dow Jones Industrial Average trims gains on Friday but still green for the week
- The Dow Jones eased somwhat on Friday, testing into 44,300.
- Despite a quiet end to the week, equities are poised for strong bullish closes.
- US PMI data came in more mixed than expected, to little effect.

The Dow Jones Industrial Average (DJIA) churned into a soft backpedal on Friday, testing down around 200 points on a slow trading day. The Dow Jones is capping off an otherwise firmly bullish week, with the index gaining around 2.3% from Monday’s opening bids. The DJIA has gained ground for the second week in a row, firmly hinting that the bull market is back after a six-week backslide.
President Donald Trump stoked the flames of pro-equity sentiment this week by not instituting the day-one tariffs he promised on the campaign trail. He also announced this week that he would “demand” lower interest rates from the Federal Reserve (Fed) and plans to request a drop in oil prices from Saudi Arabia and the Organization of the Petroleum Exporting Countries (OPEC).
The S&P Global Purchasing Managers Index (PMI) survey results for January were even more mixed than analysts anticipated. According to an ambiguous number of survey respondents, businesses saw a better-than-expected improvement in forward-looking expectations for growth in the manufacturing sector. Still, services-based businesses are more despondent about future business conditions than most anticipated.
January’s Manufacturing sector PMI rose to 50.1 from the previous month’s 49.4, surpassing the forecast of 49.6. The Services PMI for the same period shrank to 52.8 from 56.8, well below the expected 56.5, but still remains in positive territory overall, meaning purchasing managers who bothered to respond to the survey don’t expect much growth in the coming month, but don’t expect an outright contraction in business conditions either.
Dow Jones news
Despite some steeper losses in key overweighted stocks dragging the Dow slightly lower on Friday, the index itself is roughly on balance, with about half of the board’s listed equities still finding higher ground to wrap up the trading week. Walt Disney Co (DIS) rallied 1.8% to $113 per share, mainly on the back of expectations that past performance is indicative of future results after the entertainment monolith returned 24% over 2024 to people holding its shares. On the low side, Nvidia (NVDA) fell 2.5%, declining below $144 per share as investors fear the company may be doomed now that its run of seeing 100%-plus growth in annualized revenues may be over.
Dow Jones price forecast
The Dow Jones Industrial Average is once again knocking on record highs just above 45,000 set late last November. The DJIA initially declined 7.4% top-to-bottom in a six week backslide after posting the fresh record, but the wheels are back on the road as buyers continue to tilt into risk appetite.
The Dow Jones has climbed 6.8% from January’s swing low into 41,730, testing the 44,500 region after closing in the green for all but one of the last nine consecutive trading sessions. The immediate barrier to fresh record highs will be 45,000 major handle itself, while a pullback to the 50-day Exponential Moving Average (EMA) near 43,275 could hamper bullish momentum.
Dow Jones daily chart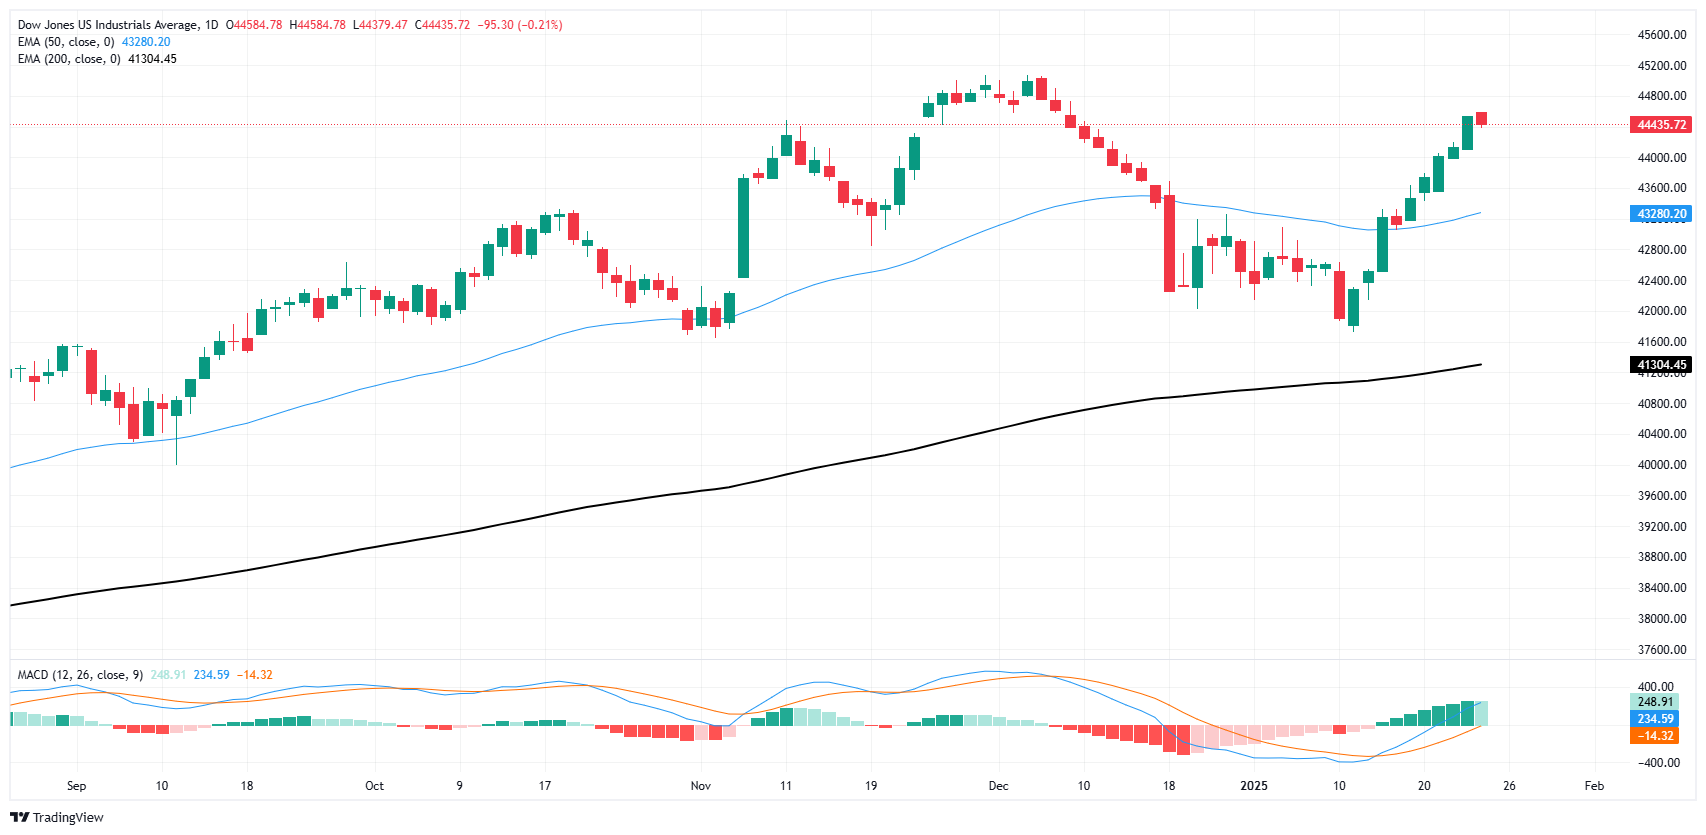
Dow Jones FAQs
The Dow Jones Industrial Average, one of the oldest stock market indices in the world, is compiled of the 30 most traded stocks in the US. The index is price-weighted rather than weighted by capitalization. It is calculated by summing the prices of the constituent stocks and dividing them by a factor, currently 0.152. The index was founded by Charles Dow, who also founded the Wall Street Journal. In later years it has been criticized for not being broadly representative enough because it only tracks 30 conglomerates, unlike broader indices such as the S&P 500.
Many different factors drive the Dow Jones Industrial Average (DJIA). The aggregate performance of the component companies revealed in quarterly company earnings reports is the main one. US and global macroeconomic data also contributes as it impacts on investor sentiment. The level of interest rates, set by the Federal Reserve (Fed), also influences the DJIA as it affects the cost of credit, on which many corporations are heavily reliant. Therefore, inflation can be a major driver as well as other metrics which impact the Fed decisions.
Dow Theory is a method for identifying the primary trend of the stock market developed by Charles Dow. A key step is to compare the direction of the Dow Jones Industrial Average (DJIA) and the Dow Jones Transportation Average (DJTA) and only follow trends where both are moving in the same direction. Volume is a confirmatory criteria. The theory uses elements of peak and trough analysis. Dow’s theory posits three trend phases: accumulation, when smart money starts buying or selling; public participation, when the wider public joins in; and distribution, when the smart money exits.
There are a number of ways to trade the DJIA. One is to use ETFs which allow investors to trade the DJIA as a single security, rather than having to buy shares in all 30 constituent companies. A leading example is the SPDR Dow Jones Industrial Average ETF (DIA). DJIA futures contracts enable traders to speculate on the future value of the index and Options provide the right, but not the obligation, to buy or sell the index at a predetermined price in the future. Mutual funds enable investors to buy a share of a diversified portfolio of DJIA stocks thus providing exposure to the overall index.
Author

Joshua Gibson
FXStreet
Joshua joins the FXStreet team as an Economics and Finance double major from Vancouver Island University with twelve years' experience as an independent trader focusing on technical analysis.


