Dow Jones Industrial Average shudders as Middle East escalation continues
- The Dow Jones shed over 300 points on Tuesday, with geopolitical tensions on the rise.
- Equities are slowly bouncing back but remain mired in the low side.
- Meager US ISM data did little to provide support for investors.

The Dow Jones Industrial Average (DJIA) plunged early Tuesday, driven into the low end by a mix of disappointing US industrial figures and renewed threats of a spillover in the Israel-Hamas conflict. US ISM Manufacturing Purchasing Managers Index (PMI) figures failed to rebound in September, as many market participants had hoped for. Israel’s recent military strikes on alleged Hamas targets in Lebanon have sparked a threat of retaliation from Iran, significantly widening the scope of the Middle East conflict.
September’s US ISM Manufacturing PMI remained stubbornly entrenched at 47.2 for a second consecutive month, entirely missing the expected uptick to 47.5. ISM Manufacturing Prices Paid also backslid more than expected over the same period, falling into contractionary territory at 48.3, down from the previous 54.0.
Looking further into US data, JOLTS Job Openings in August rose to 8.04 million, over and above the previous period’s revised 7.7 million, but the widening expanse of listed job openings may not be translating directly into new hires after the ISM Manufacturing Employment Index for September fell to 43.9 from the previous 46.0, entirely missing the forecast upswing to 47.0.
Investor attention has swung around to focus fully on Middle East geopolitical tensions after early reports that Iran has executed a first missile barrage against Israel in response to Israel’s recent invasion of Lebanon. The US has declared it will retaliate on Israel’s behalf, and investors are balking at the prospect of a rapid escalation of the ongoing conflict.
Dow Jones news
Roughly two-thirds of the Dow Jones stock index is in the red on Tuesday, with limited gains for the winners. Chevron (CVX) has been on the rise recently, gaining ground after announcing last week that the company would not be shelling out the capital to make heavy investments in developing LNG refineries within the US. Investors rewarded the energy company for keeping its cash resources close to the chest, and Chevron is up a further 1.6% on Tuesday, rising toward $150 per share.
Going in the opposite direction, Intel (INTC) is back into the red, declining 4.7% on Tuesday and tumbling below $22.50 per share as shareholders, who were recently spurred on by hopes of a mega-merger between Intel and competing chipmaker Qualcomm (QCOM). However, the reality that regulators are unlikely to allow a single company to dominate the overwhelming majority of global silicon chip printing is weighing heavily on traders.
Dow Jones price forecast
Dow Jones’ flub sees the major equity index testing back into the 42,000 handle, and bidders are struggling to recover balance despite etching in fresh all-time highs late last week. Despite a bearish intraday shock on Tuesday, the DJIA remains well-bid overall, up over 5% from the last notable swing low in mid-September into the 40,000 handle.
Dow Jones daily chart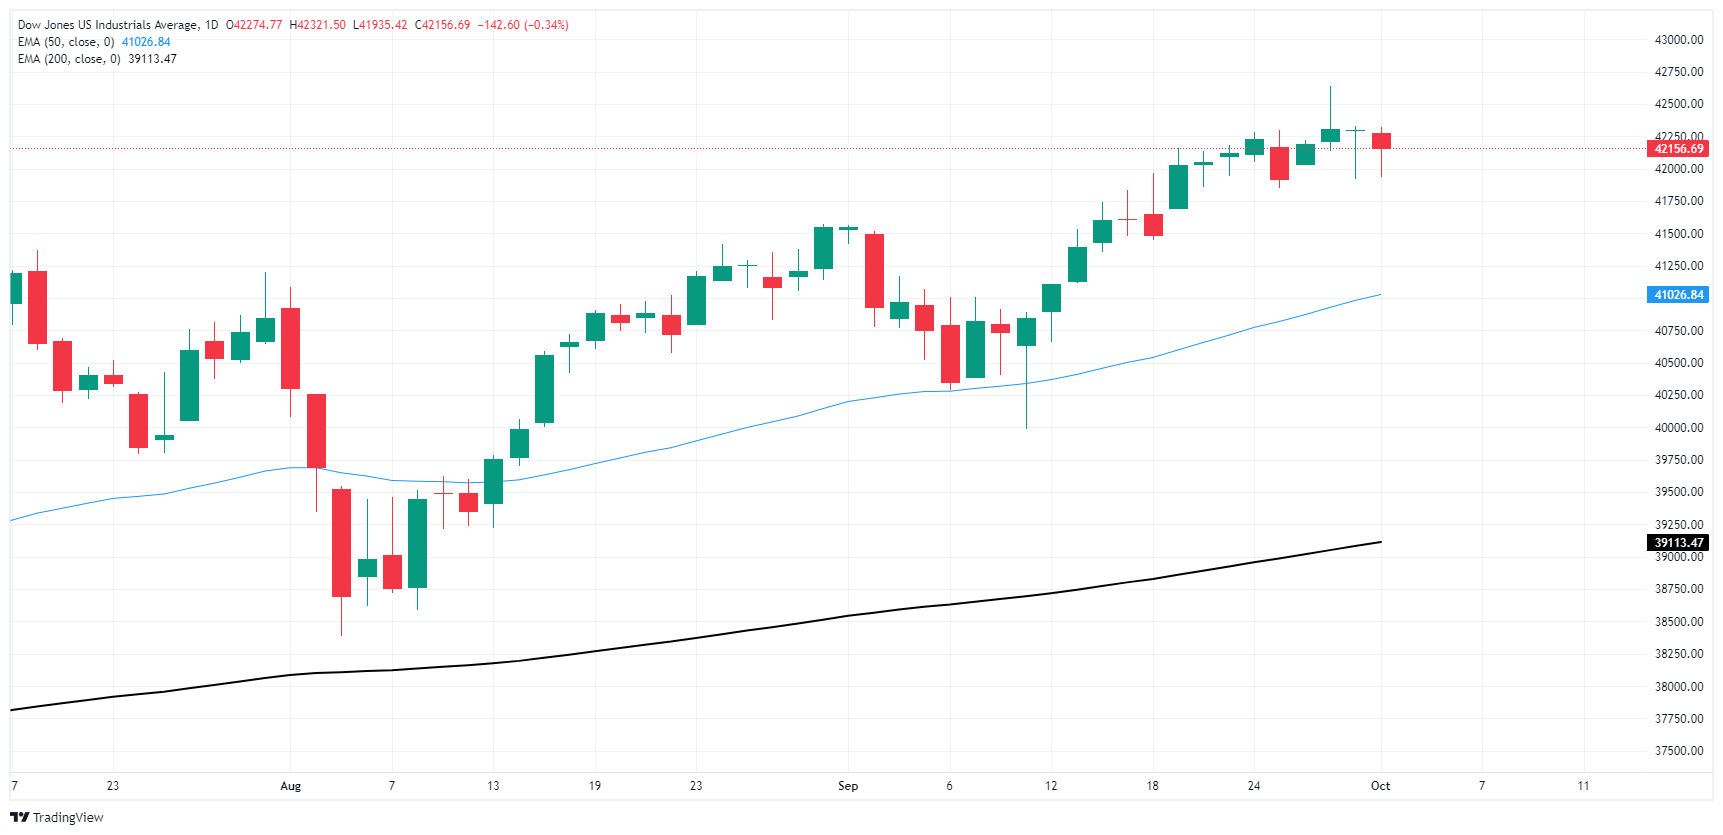
Dow Jones FAQs
The Dow Jones Industrial Average, one of the oldest stock market indices in the world, is compiled of the 30 most traded stocks in the US. The index is price-weighted rather than weighted by capitalization. It is calculated by summing the prices of the constituent stocks and dividing them by a factor, currently 0.152. The index was founded by Charles Dow, who also founded the Wall Street Journal. In later years it has been criticized for not being broadly representative enough because it only tracks 30 conglomerates, unlike broader indices such as the S&P 500.
Many different factors drive the Dow Jones Industrial Average (DJIA). The aggregate performance of the component companies revealed in quarterly company earnings reports is the main one. US and global macroeconomic data also contributes as it impacts on investor sentiment. The level of interest rates, set by the Federal Reserve (Fed), also influences the DJIA as it affects the cost of credit, on which many corporations are heavily reliant. Therefore, inflation can be a major driver as well as other metrics which impact the Fed decisions.
Dow Theory is a method for identifying the primary trend of the stock market developed by Charles Dow. A key step is to compare the direction of the Dow Jones Industrial Average (DJIA) and the Dow Jones Transportation Average (DJTA) and only follow trends where both are moving in the same direction. Volume is a confirmatory criteria. The theory uses elements of peak and trough analysis. Dow’s theory posits three trend phases: accumulation, when smart money starts buying or selling; public participation, when the wider public joins in; and distribution, when the smart money exits.
There are a number of ways to trade the DJIA. One is to use ETFs which allow investors to trade the DJIA as a single security, rather than having to buy shares in all 30 constituent companies. A leading example is the SPDR Dow Jones Industrial Average ETF (DIA). DJIA futures contracts enable traders to speculate on the future value of the index and Options provide the right, but not the obligation, to buy or sell the index at a predetermined price in the future. Mutual funds enable investors to buy a share of a diversified portfolio of DJIA stocks thus providing exposure to the overall index.
Author

Joshua Gibson
FXStreet
Joshua joins the FXStreet team as an Economics and Finance double major from Vancouver Island University with twelve years' experience as an independent trader focusing on technical analysis.


