|

Dow futures (YM) breaking to new all-time high [Video]

Dow Futures (YM) has broken to new all-time high, suggesting the trend remains firmly bullish. It also suggests the next bullish cycle has started.  Short term, rally from 11.10.2023 low is currently in progress as a 5 waves impulse Elliott Wave structure. Up from 11.10.2023 low, wave ((i)) ended at 36337 and dips in wave ((ii)) ended at 36022. Internal subdivision of wave ((ii)) unfolded as a zigzag structure. Down from wave ((i)), wave (a) ended at 36066, wave (b) ended at 36352, and wave (c) lower ended at 36022. This completed wave ((ii)) in higher degree. Index has resumed higher in wave ((iii)) and broken to new all-time high.

Dow futures (YM) 60 minutes Elliott Wave chart

Chart

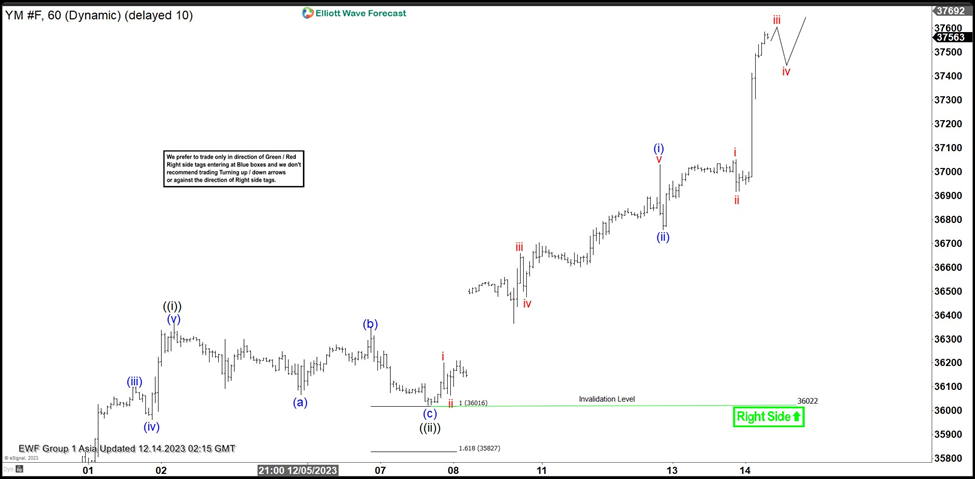
Up from wave ((ii)), wave i ended at 36201 and wave ii ended at 36064. Wave iii higher ended at 36659, wave iv ended at 36476, and wave v higher ended at 37030. This completed wave (i) in higher degree. Pullback in wave (ii) ended at 36758. Index has resumed higher again in wave (iii). Up from wave (ii), wave i ended at 37051 and pullback in wave ii ended at 36917. Expect wave iii to end soon, then Index should pullback in wave iv, and then extend higher again. Near term, as far as pivot at 36022 low stays intact, expect pullback to find support in 3, 7, or 11 swing for further upside.

Dow futures (YM) Elliott Wave video

Author

Elliott Wave Forecast Team

Elliott Wave Forecast Team

ElliottWave-Forecast.com

More from Elliott Wave Forecast Team
Share:

Markets move fast. We move first.

Orange Juice Newsletter brings you expert driven insights - not headlines. Every day on your inbox.

By subscribing you agree to our Terms and conditions.

Editor's Picks

EUR/USD eyes 1.1800 barrier near two-month highs

EUR/USD extends its gains for the second consecutive day on Tuesday and approaches 1.1800. On the daily chart, technical analysis indicates a persistent bullish bias, as the pair moves upward within the ascending channel pattern. Additionally, the 14-day Relative Strength Index at 68.89 reaffirms the bullish bias.

GBP/USD climbs to 1.3500 area, renews ten-week high

GBP/USD extends its weekly rally and trades at its highest level since early October near 1.3500. The US Dollar remains under persistent bearish pressure heading into the holidays, while Pound traders largely brush off the latest interest rate cut from the Bank of England.

Gold approaches $4,500 as record-setting rally continues

Gold builds on Monday's impressive gains and advances toward $4,500, setting fresh record-highs along the way. Heightened geopolitical tensions, combined with the broad-based US Dollar (USD) weakness ahead of the Q3 GDP data, help XAU/USD preserve its bullish momentum.

Uniswap holds above $6 as traders eye UNIfication vote outcome

Uniswap price holds above $6 at the time of writing on Tuesday after closing above a key resistance zone in the previous week. Traders are focusing on the highly anticipated UNIfication proposal, which is set to conclude on Thursday, and could become a key near-term catalyst. On the technical side, momentum indicators are flashing bullish signals, hinting at an upside rally.

Ten questions that matter going into 2026

2026 may be less about a neat “base case” and more about a regime shift—the market can reprice what matters most (growth, inflation, fiscal, geopolitics, concentration). The biggest trap is false comfort: the same trades can look defensive… right up until they become crowded.

XRP steadies above $1.90 support as fund inflows and retail demand rise

Ripple (XRP) is stable above support at $1.90 at the time of writing on Monday, after several attempts to break above the $2.00 hurdle failed to materialize last week. Meanwhile, institutional interest in the cross-border remittance token has remained steady.