|

Dollar Index Price Analysis: The greenback capitulation continues into the close and heads to a massive support

  • The DXY is 1.72% lower over the week as the index continues to fall on Friday.
  • The US continues to struggle with the COVID-19 pandemic and a multitude of issues.

Dollar Index weekly chart

The dollar's spectacular demise is continuing into the end of the week. The greenback has even lost ground against the Japanese yen which has been holding in a consolidation range for a while. On some of the major currency pairs, the price is heading to some big levels on the weekly charts and the dollar index is no different. 

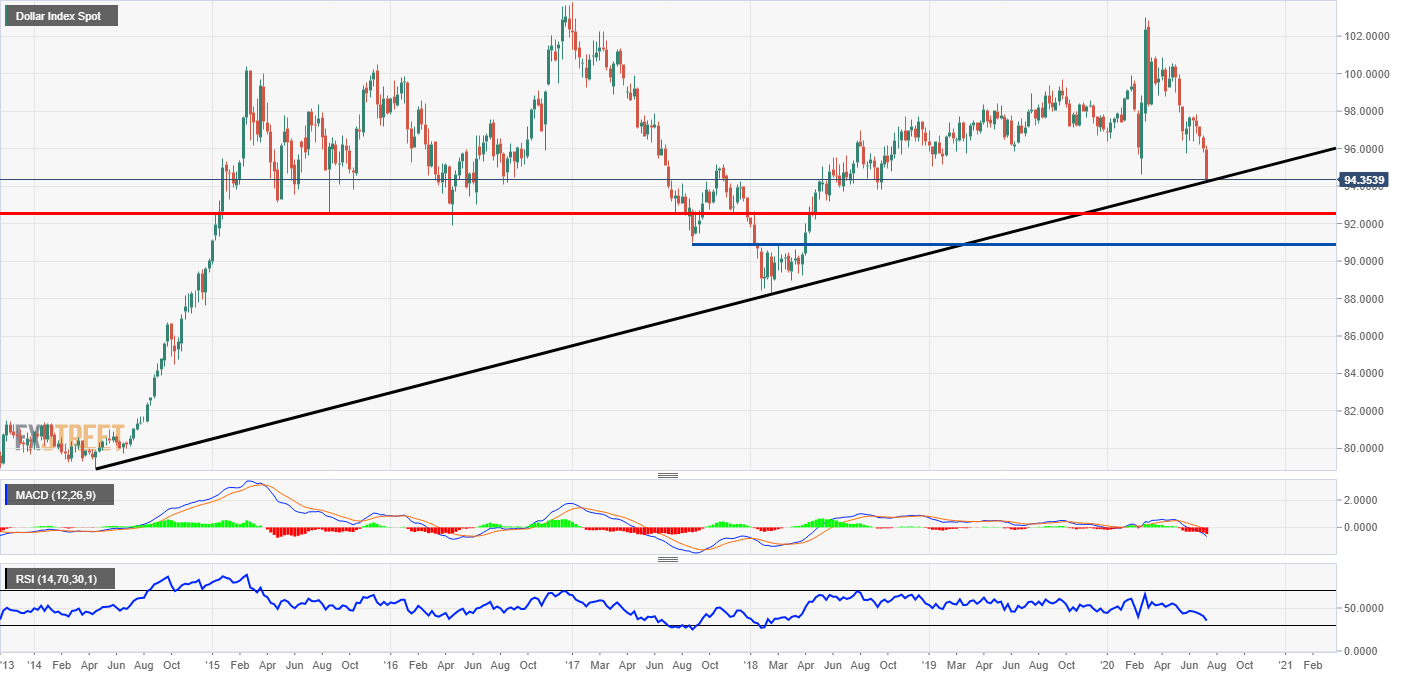
The chart shows the index is heading to a big trendline on the weekly timeframe. This trendline spans six years and could be a support zone for the oversold dollar. Below this level, there is another key zone at the red horizontal line at 92.45 and then again lower at 90.80. The major swing low is holding at 88.25 and a break of this level would take the index to its lowest level in ten years. 

The indicators are obviously in a very bearish place. The MACD histogram is firmly in the red and the signal lines are also under zero. The Relative Strength Index is heading to the oversold area but there is still some space to the downside. 

Dollar sell off

Additional levels

Dollar Index Spot

Overview
Today last price94.35
Today Daily Change-0.44
Today Daily Change %-0.46
Today daily open94.79
 
Trends
Daily SMA2096.47
Daily SMA5097.31
Daily SMA10098.47
Daily SMA20098.15
 
Levels
Previous Daily High95.19
Previous Daily Low94.59
Previous Weekly High96.7
Previous Weekly Low95.78
Previous Monthly High98.24
Previous Monthly Low95.72
Daily Fibonacci 38.2%94.82
Daily Fibonacci 61.8%94.96
Daily Pivot Point S194.52
Daily Pivot Point S294.26
Daily Pivot Point S393.92
Daily Pivot Point R195.12
Daily Pivot Point R295.45
Daily Pivot Point R395.72

Author

Rajan Dhall, MSTA

Rajan Dhall is an experienced market analyst, who has been trading professionally since 2007 managing various funds producing exceptional returns.

More from Rajan Dhall, MSTA
Share:

Editor's Picks

EUR/USD flirts with weekly lows near 1.1770

EUR/USD now comes under further selling pressure, breaking below the 1.1800 support to challenge the area of weekly throughs near 1.1770 on Thursday. The pair’s decline comes in response to marked gains in the US Dollar amid steady geopolitical tensions. Ealier in the day, the ECB’s Lagarde delivered cautious remarks, although the currency remained apathetic.

GBP/USD threatens the 200-day SMA near 1.3440

GBP/USD rapidly leaves behind Wednesday’s strong advance, coming under heavy pressure and retesting the 1.3440 zone, where the critical 200-day SMA is located. Cable’s deep pullback follows the strong gains in the Greenback, while investors continue to pencil in a potential BoE rate cut in March.

Gold trims gains, slips back to around $5,170

Gold is now facing some downside pressure, hovering around the $5,170 region on Thursday. The yellow metal surrenders part of its earlier gains on the back of the resurgence of the buying interest in the Greenback. In the meantime, geopolitical tensions in the Middle East continue to limit the downside potential for now.

Stellar: Relief bounce fades as bearish undertone persists

Stellar is trading around $0.16 at the time of writing on Thursday after rebounding more than 8% in the previous day. Derivatives data paints a negative picture as XLM’s short bets hit a monthly high while Open Interest continues to decline.

Changing the game: International implications of recent tariff developments

The Supreme Court ruling on International Emergency Economic Powers Act (IEEPA) tariffs provides limited relief for the rest of the world, with weighted average tariff rates modestly lower.

Bitcoin steadies as traders eye US–Iran talks

Bitcoin (BTC) price is stabilizing around $68,000 at the time of writing on Thursday after a 6.2% relief rally the previous day amid a broader downward trend.