Disney (DIS Stock) no rally for a while until double correction is done
Since the crash of March 2020, all stocks have tried to recover what they lost, and Disney was no exception. Disney did not only recover from the loss, but It also reached historic highs. Now, we are going to try to build an impulse from the March 2020 lows with a target of around $230. Target measured from 0 to 2019’s high projected from March’s low, equal legs. Since we begin with this analysis on February 13th, we bought the share in 160.97 then the market broke to a new historical high and reached the first target at 190.88 after hours. The target gave us a return of +18.58% in 12 days.
Disney old daily chart
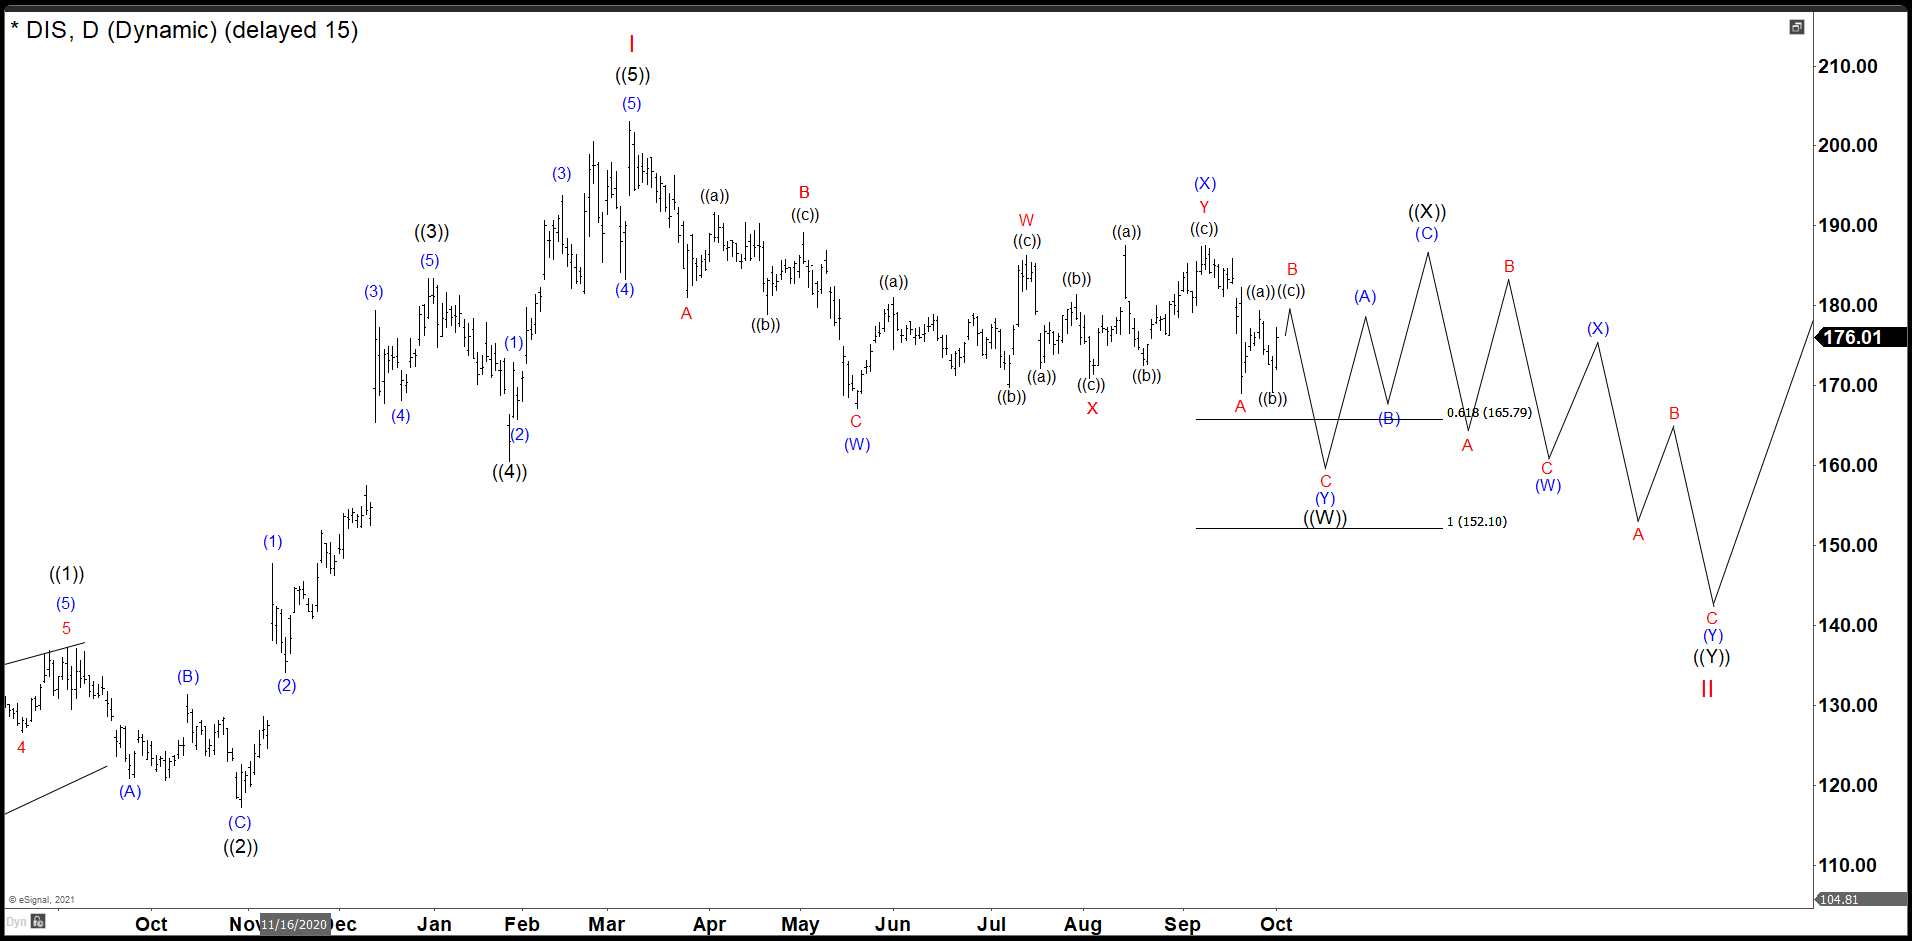
We relabeled Disney impulse building a leading diagonally from March 2020 low ending at 137.34 as wave ((1)). Then a zig-zag correction as wave ((2)) finishes at 117.19. Wave ((3)) is a clear impulse that ended at 183.54 and wave ((4)) pullback ended at 160.57. The last push to the upside to complete wave ((5)) and Wave I topped at 203.01. From there, the stock did 3 swings down gave us the idea that we need one more rally to complete the impulse to the $230.00 target, but the lagging in time from last months was too long to think about that rally and it was better to think that we were already in wave II correction.
Therefore, Disney stock began to build a double correction. Down from the peak 3 swings completed wave (W) at 167.10. Then, we had 7 swings higher to complete wave (X) at 187.58 and we were looking for 3 swings more to complete wave (Y) and the first leg of ((W)) in 165.79 – 152.18 area. (If you want to learn more about Elliott Wave Theory, please follow these links: Elliott Wave Education and Elliott Wave Theory).
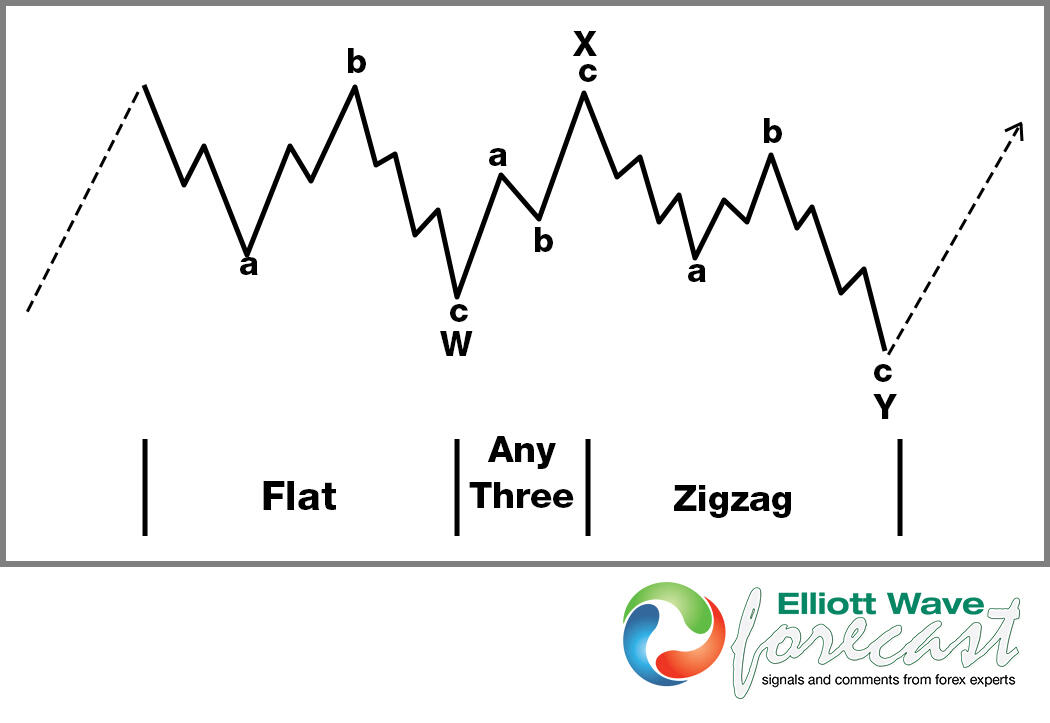
Elliott Wave theory double correction structure
Disney daily chart
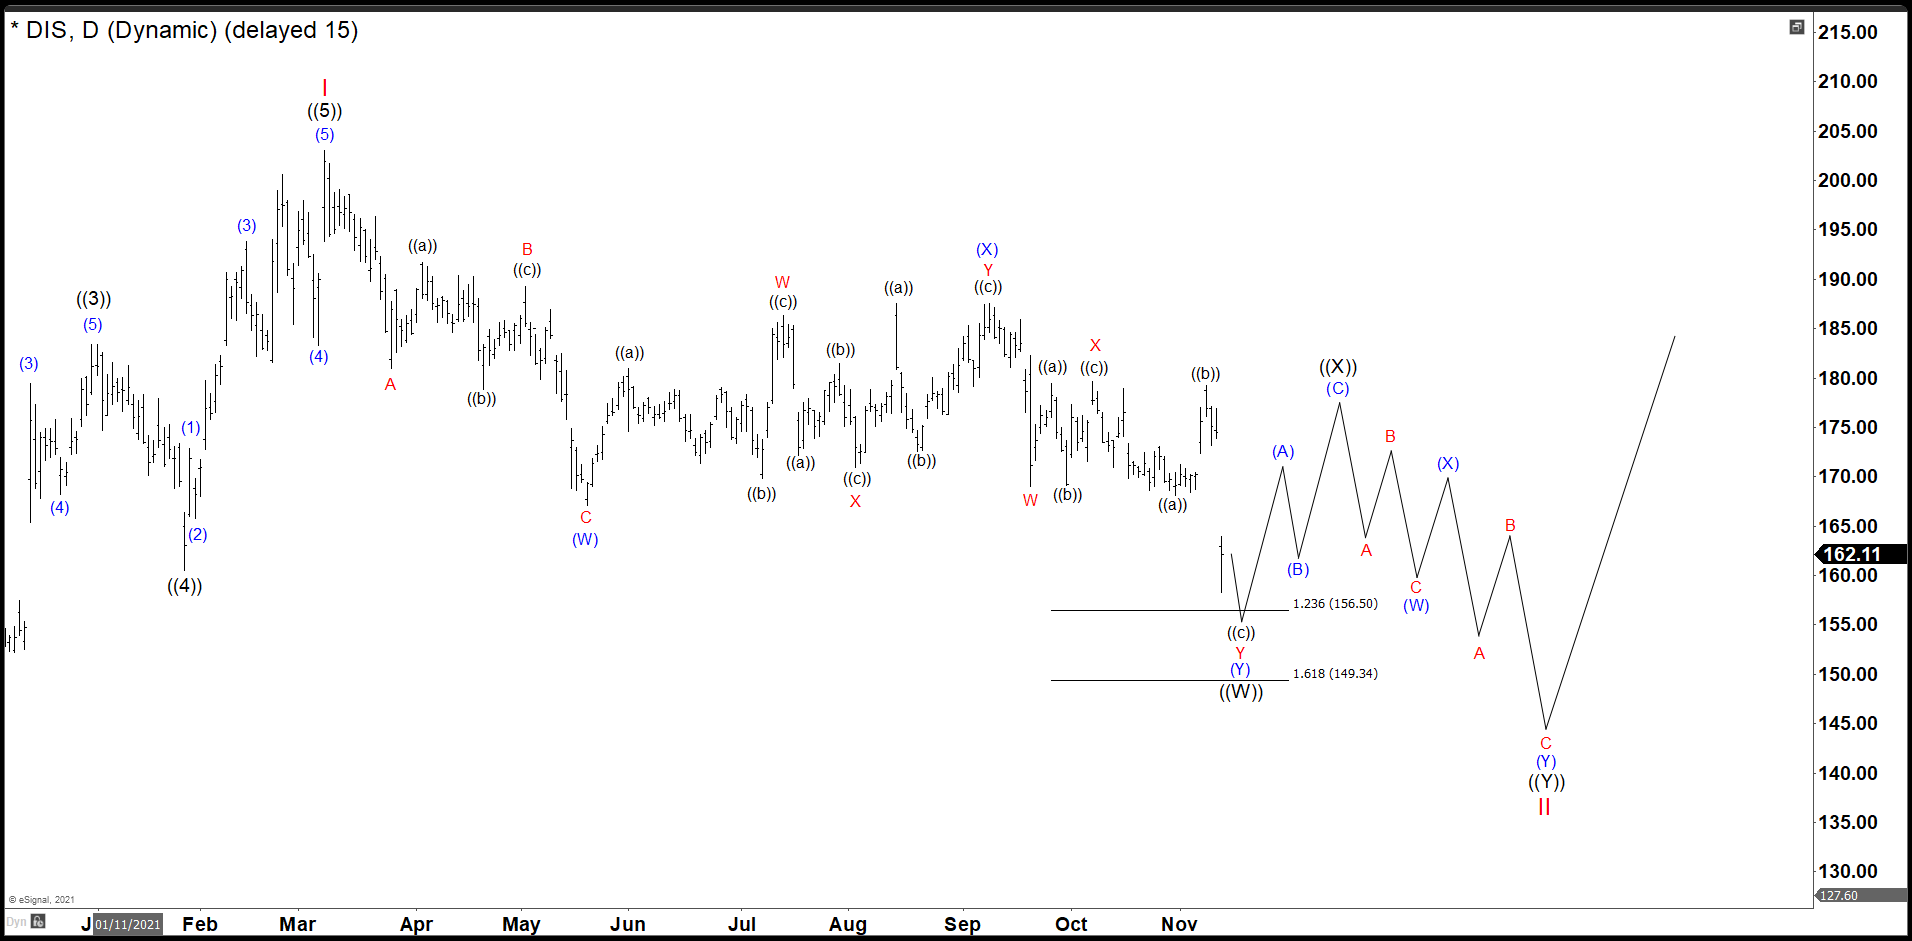
After a month, wave (Y) of ((W)) is still developing and we could appreciate clearly a double correction structure. In lesser degree from X at 179.63, we have an incomplete ((a)), ((b)), ((c)) flat correction. Wave ((c)) of Y of (Y) reacted down finding support at 158.33, but it looks to need one more low to complete an impulse and we have considered an area of 156.50 – 149.34 to end this structure.
Then we should bounce in 3 swings that should fail to complete the connector ((X)) and further downside should take place. This last face should have the same structure as the first one, that is a double correction (W), (X), (Y) to complete wave ((Y)) and also wave II. We will look to buy when wave II is done.
Premium
You have reached your limit of 3 free articles for this month.
Start your subscription and get access to all our original articles.
Author

Elliott Wave Forecast Team
ElliottWave-Forecast.com


