Deere & Co. (DE) Elliott Wave technical analysis [Video]
![Deere & Co. (DE) Elliott Wave technical analysis [Video]](https://editorial.fxstreet.com/images/TechnicalAnalysis/ChartPatterns/Candlesticks/high-resolution-stock-exchange-evolution-panel-55741904_XtraLarge.jpg)
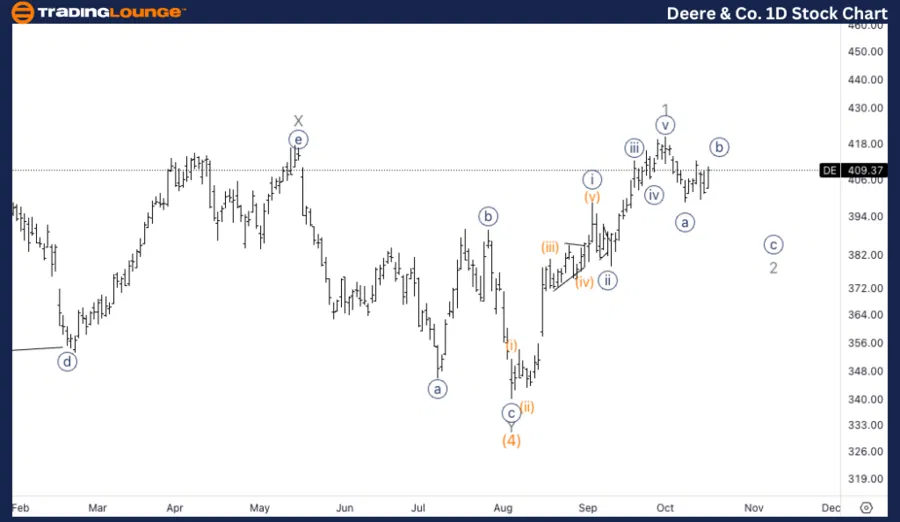
DE Elliott Wave Analysis Trading Lounge daily chart.
DE Elliott Wave technical analysis
Function: Trend
Mode: Impulsive
Structure: Motive
Position: Wave 1 of (1).
Direction: Bottom in wave 2 of (1).
Details: Looking for a clear three wave move within wave 2 as we seem to have potentially completed the long lasting correction in Intermediate (4).
DE Elliott Wave technical analysis – Daily chart
On the daily chart, Deere & Co. appears to have completed a long correction in Intermediate wave (4). The market is now in the early stages of Wave 1 of (1), with a potential bottom in place for Wave 2, marking the end of the corrective phase. A three-wave move within Wave 2 seems evident, signaling that the next impulsive move higher might begin soon.
Deere & Co., (DE) one-hour chart.
DE Elliott Wave technical analysis
Function: Trend.
Mode: Impulsive.
Structure: Motive.
Position: Wave {b} of 2.
Direction: Downside in wave {c}.
Details: Looking for one more leg lower in wave {c} as we seem to be missing one leg in the overall correction in wave 2.
DE Elliott Wave technical analysis – One-hour chart
On the 1-hour chart, DE is currently in Wave {b} of 2, and it appears that one more leg lower in Wave {c} is necessary to complete the overall correction in Wave 2. This indicates that the downside movement may continue briefly before the market reverses and resumes an upward trajectory once Wave 2 completes.

This Elliott Wave analysis of Deere&Co., (DE) outlines both the daily and 1-hour chart structures, highlighting the current trends and possible future price movements.
Deere & Co. (DE) Elliott Wave technical analysis [Video]
Author

Peter Mathers
TradingLounge
Peter Mathers started actively trading in 1982. He began his career at Hoei and Shoin, a Japanese futures trading company.


