DAX (Germany) Index Elliott Wave technical analysis [Video]
![DAX (Germany) Index Elliott Wave technical analysis [Video]](https://editorial.fxstreet.com/images/Markets/Equities/DAX/dax-euro-concept-47253534_XtraLarge.jpg)
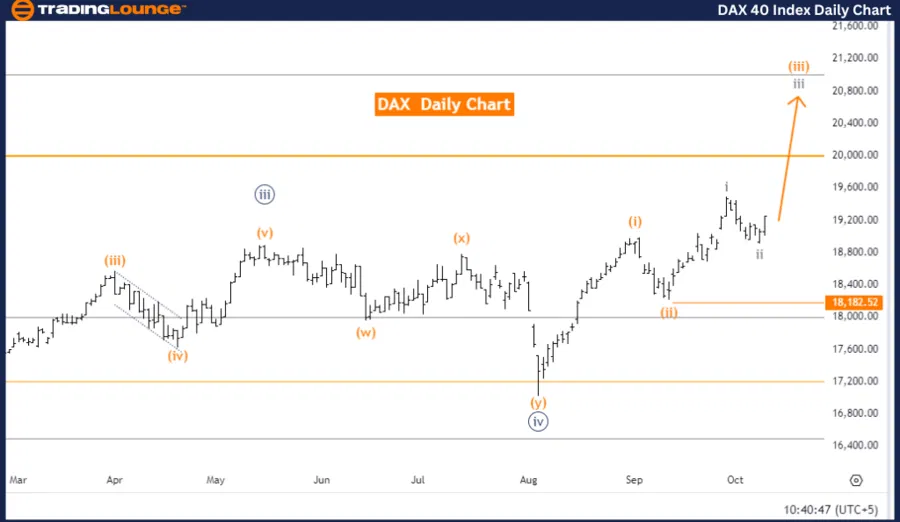
DAX (Germany) Elliott Wave Analysis Trading Lounge Day Chart
DAX (Germany) Elliott Wave technical analysis
Function: Bullish Trend.
Mode: Impulsive.
Structure: Gray Wave 3.
Position: Orange Wave 3.
Direction next lower degrees: Gray Wave 4.
Details: Gray Wave 2 appears complete. Currently, Gray Wave 3 of Orange Wave 3 is in progress.
Wave cancel invalid level: 18,182.52.
The daily chart of the DAX (Germany) suggests a bullish trend within an impulsive wave structure. The market is currently in Gray Wave 3, situated within Orange Wave 3, indicating strong upward movement.
Gray Wave 2 appears to have concluded, and the market is now unfolding Gray Wave 3 of Orange Wave 3, which is actively driving the bullish momentum. The impulsive wave structure typically indicates a strong trend, with Gray Wave 3 being a more forceful part of the Elliott Wave sequence.
The next lower-degree wave will be Gray Wave 4, which is expected to follow the completion of the current wave structure. However, for now, Gray Wave 3 remains active, and the market continues to progress upward within this bullish framework.
The wave cancellation level is identified at 18,182.52. A decline below this level would invalidate the current Elliott Wave count, potentially signaling the end of the current upward movement or the emergence of a new wave pattern.
In summary, the DAX is trending bullish, with Gray Wave 3 of Orange Wave 3 currently unfolding. Gray Wave 2 is complete, leading to further upward progression. As long as the price remains above the invalidation level of 18,182.52, the bullish trend is expected to continue.
DAX (Germany) Elliott Wave Analysis Trading Lounge weekly chart
DAX (Germany) Elliott Wave technical analysis
Function: Bullish Trend.
Mode: Impulsive.
Structure: Navy Blue Wave 5.
Position: Gray Wave 3.
Direction next lower degrees: Gray Wave 4.
Details: Navy Blue Wave 4 appears complete. Now, Navy Blue Wave 5 is in play.
Wave cancel invalid level: 18,182.52.
The weekly chart of the DAX (Germany) points to a bullish trend operating within an impulsive mode. The current structure shows the market in Navy Blue Wave 5, with the position in Gray Wave 3, indicating further upward momentum.
Navy Blue Wave 4 seems to have concluded, and now Navy Blue Wave 5 is unfolding, suggesting that the market is advancing into the final phase of the Elliott Wave cycle for this higher degree. The impulsive nature of Navy Blue Wave 5 is driving the ongoing bullish trend.
The next lower degree wave points to Gray Wave 4, which is expected to develop after Gray Wave 3 completes. However, at present, Gray Wave 3 is in progress, contributing to the current upward price movement.
The wave cancellation level is set at 18,182.52. A drop below this level would invalidate the current Elliott Wave count, possibly signaling the end of the bullish trend or the onset of a corrective phase.
In summary, the DAX is trending upward, with Navy Blue Wave 5 unfolding after the completion of Navy Blue Wave 4. The market remains on a bullish path, and as long as the price stays above the invalidation level of 18,182.52, the bullish outlook is expected to persist, with Gray Wave 3 driving prices higher.

DAX (Germany) Index Elliott Wave technical analysis [Video]
Author

Peter Mathers
TradingLounge
Peter Mathers started actively trading in 1982. He began his career at Hoei and Shoin, a Japanese futures trading company.


