DAX (Germany) Elliott Wave technical analysis [Video]
![DAX (Germany) Elliott Wave technical analysis [Video]](https://editorial.fxsstatic.com/images/i/Equity-Index_DAX-2_XtraLarge.jpg)
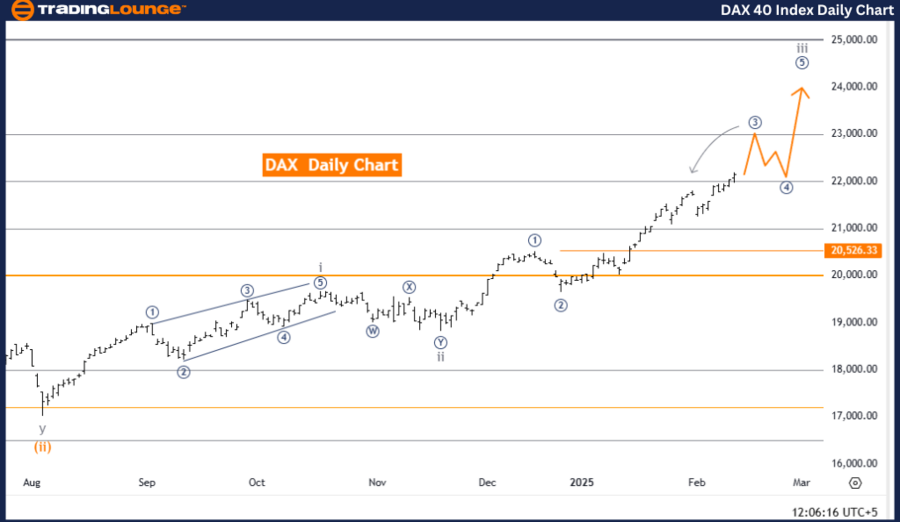
DAX (Germany) Elliott Wave Analysis – Trading Lounge day chart.
DAX (Germany) Elliott Wave technical analysis
-
Function: Bullish Trend
-
Mode: Impulsive
-
Structure: Micro navy blue wave 3
-
Position: Gray wave 3
-
Direction next lower degrees: Micro navy blue wave 4
-
Invalidation level: 20,526.33
Details
The DAX Germany daily chart confirms a bullish trend with an impulsive wave structure currently unfolding. The market is in micro navy blue wave 3, forming part of a larger gray wave 3 structure. This setup suggests continued upward momentum, with strong buying pressure driving prices higher.
The completion of micro navy blue wave 2 has established a foundation for micro navy blue wave 3 to advance. This wave formation indicates an expansion phase, characterized by strong bullish movements. The overall trend remains positive, with further gains expected as the wave progresses.
The next lower degree wave in focus is micro navy blue wave 4, which will emerge after micro navy blue wave 3 concludes. This suggests that a corrective phase may occur before the uptrend resumes. However, the primary market direction remains bullish.
The key invalidation level for this wave structure is 20,526.33. A price drop below this level would require a reassessment of the bullish wave scenario. As long as prices stay above this threshold, the outlook remains strong, supporting further upward movement.
Summary
The DAX Germany daily chart reflects a strong bullish trend, with micro navy blue wave 3 active, reinforcing continued market strength. The invalidation level of 20,526.33 is a critical threshold, ensuring that the bullish outlook remains valid. The next wave in focus is micro navy blue wave 4, which may introduce a temporary corrective movement before the trend resumes its upward trajectory.
DAX (Germany) Elliott Wave technical analysis
-
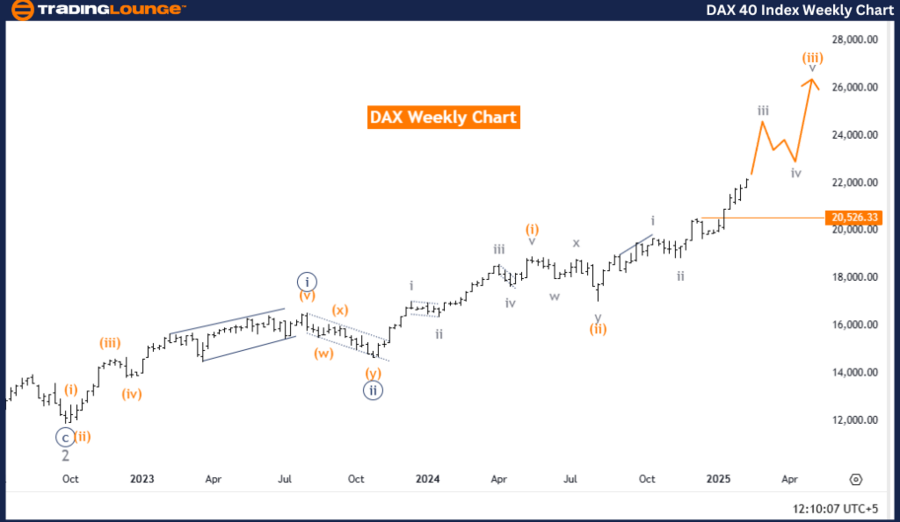
Function: Bullish Trend.
-
Mode: Impulsive.
-
Structure: Gray wave 3.
-
Position: Orange wave 3.
-
Direction next lower degrees: Gray wave 4.
-
Invalidation level: 20,526.33.
Details
The DAX Germany weekly chart confirms a bullish trend with an impulsive wave structure in place. The market is currently in gray wave 3, following the completion of gray wave 2. This wave positioning signals strong upward momentum, indicating that the index is in a growth phase with sustained buying interest.
The current wave structure places the market in orange wave 3, which is part of the broader gray wave 3 pattern. This suggests an expansionary phase, where prices continue rising in a sustained uptrend. As long as the wave structure remains intact, further gains are expected in the near term.
The next lower degree wave in focus is gray wave 4, which will emerge after gray wave 3 concludes. This indicates that a corrective phase may take place before the bullish trend resumes. However, the primary market direction remains upward.
The invalidation level for this wave structure is 20,526.33. If the price drops below this level, the bullish wave count would need reconsideration. However, as long as prices remain above this key level, the bullish outlook stays valid, with further price appreciation expected.
Summary
The DAX Germany weekly chart reflects a strong bullish trend, with gray wave 3 currently in play, confirming further market strength. The invalidation level of 20,526.33 serves as a key support threshold, ensuring that the bullish scenario remains intact. The next phase in the wave sequence is gray wave 4, which may introduce a temporary corrective movement before the trend resumes its upward trajectory.
DAX (Germany) Elliott Wave technical analysis [Video]
Author

Peter Mathers
TradingLounge
Peter Mathers started actively trading in 1982. He began his career at Hoei and Shoin, a Japanese futures trading company.


