|

DAX buying the dips at the blue box area

Hello fellow traders. In this article we’re going to take a quick look at the Elliott Wave charts of DAX published in members area of the website.  DAX  is showing impulsive bullish sequences in the cycle from the September 2022 low. Recently we got a 3 waves pull back that has ended right at the Blue Box zone (our buying area).  In the further text we are going to explain the Elliott Wave Forecast and trading setup.

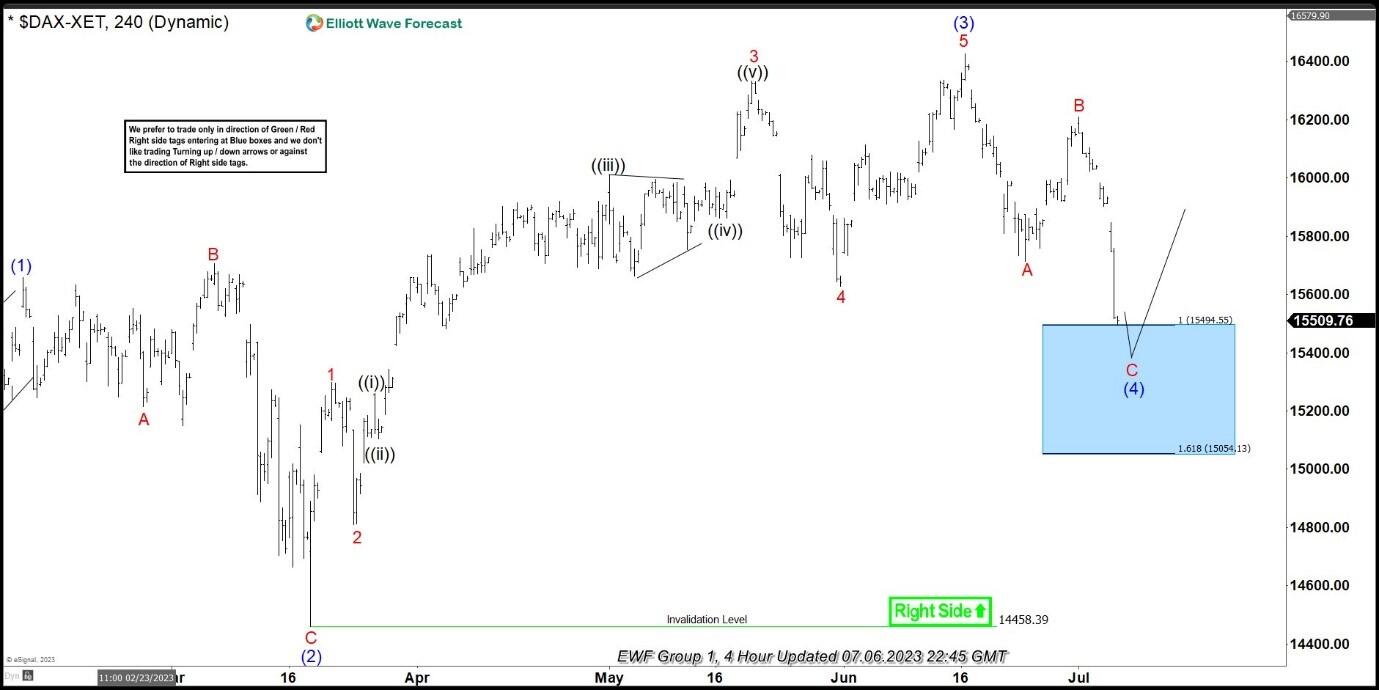
DAX Elliott Wave 4 hour chart 07.06.2022

DAX remains bullish against the 14458.39 pivot. The Index is currently giving  us pull back in 3 waves that are reaching extreme area at 15494.5-15054.1  blue box ( buying zone) .  We don’t recommend selling it and prefer the long side. DAX index should ideally make a rally toward new highs or 3 waves bounce alternatively .As our members know Blue boxes are based on 100% – 161.8%  Fibonacci extension area , that we trade in 3, 7, or 11 swing corrective sequence. Once bounce reaches 50 Fibs against the B red high , we will make long position risk free ( put SL at BE) and take partial profits. Invalidation for the long trades is break of 1.618 fib ext : 15054.1

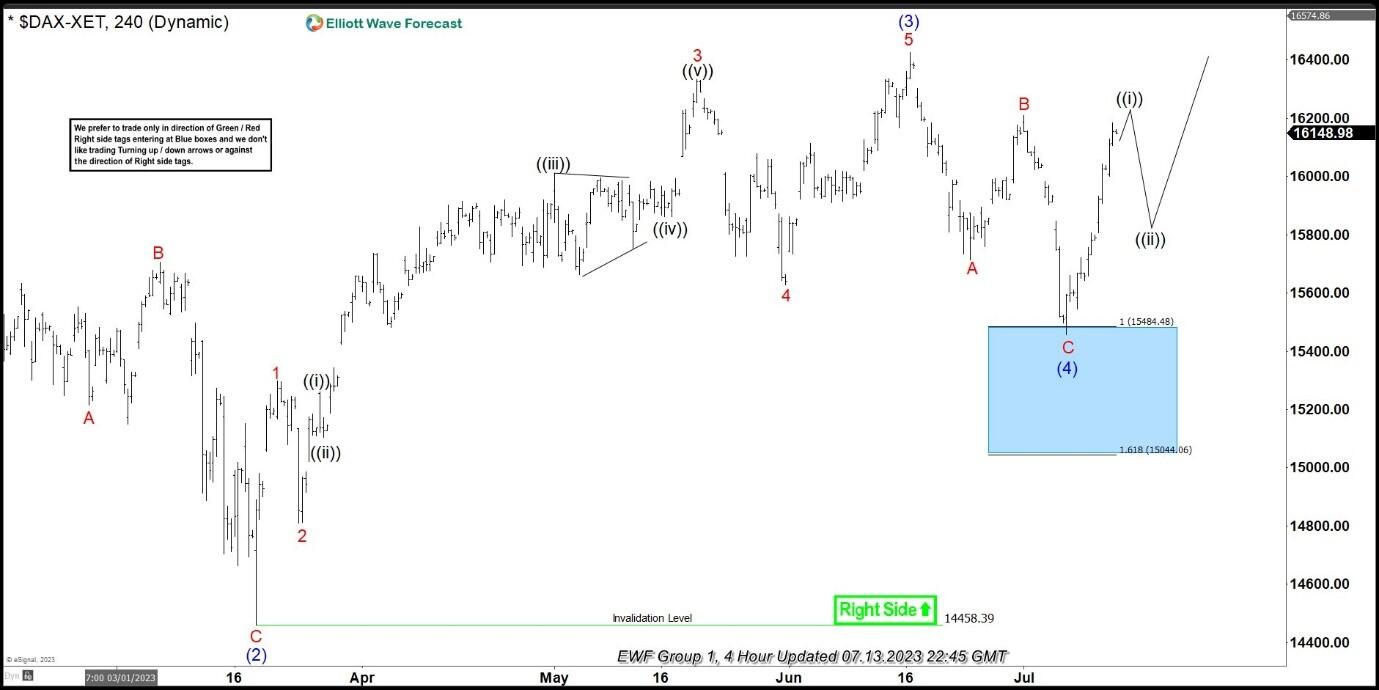
DAX Elliott Wave 4 hour chart 07.13.2022

DAX made very good reaction from our buying zone. The index has reached and exceeded 50 fibs against the B red high. So members who took the long trade are enjoying profits now in a risk free positions. We would like to see break of (3) blue high, to confirm next leg up is in progress.

Author

Elliott Wave Forecast Team

Elliott Wave Forecast Team

ElliottWave-Forecast.com

More from Elliott Wave Forecast Team
Share:

Editor's Picks

EUR/USD tests nine-day EMA support near 1.1850

EUR/USD inches lower during the Asian hours on Monday, trading around 1.1870 at the time of writing. The 14-day Relative Strength Index momentum indicator at 56 stays above the midline, confirming improving momentum. RSI has cooled from prior overbought readings but stabilizes above 50, suggesting dips could stay limited before buyers reassert control.

GBP/USD flat lines as traders await key UK macro data and FOMC minutes

The GBP/USD pair kicks off a new week on a subdued note and oscillates in a narrow range, just below mid-1.3600s, during the Asian session. Moreover, the mixed fundamental backdrop warrants some caution for aggressive traders as the market focus now shifts to this week's important releases from the UK and the US.

Gold slides below $5,000 amid USD uptick and positive risk tone; downside seems limited

Gold attracts fresh sellers at the start of a new week and reverses a part of Friday's strong move up of over $150 from sub-$4,900 levels. The commodity slides back below the $5,000 psychological mark during the Asian session, though the downside potential seems limited amid a combination of supporting factors.

Bitcoin, Ethereum and Ripple consolidate within key ranges as selling pressure eases

Bitcoin and Ethereum prices have been trading sideways within key ranges following the massive correction. Meanwhile, XRP recovers slightly, breaking above the key resistance zone. The top three cryptocurrencies hint at a potential short-term recovery, with momentum indicators showing fading bearish signs.

Global inflation watch: Signs of cooling services inflation

Realized inflation landed close to expectations in January, as negative base effects weighed on the annual rates. Remaining sticky inflation is largely explained by services, while tariff-driven goods inflation remains limited even in the US.

Ripple Price Forecast: XRP potential bottom could be in sight

Ripple edges up above the intraday low of $1.35 at the time of writing on Friday amid mixed price actions across the crypto market. The remittance token failed to hold support at $1.40 the previous day, reflecting risk-off sentiment amid a decline in retail and institutional sentiment.