|

CSL Limited Elliott Wave technical forecast [Video]

ASX: CSL Elliott Wave technical analysis – TradingLounge

Today's Elliott Wave analysis provides an update on the Australian Stock Exchange (ASX) focusing on CSL LIMITED (CSL).

There is significant upside potential in the third wave of ASX:CSL. This analysis will offer insights into possible trend reversals and highlight key price points that confirm when a bullish trend strengthens.

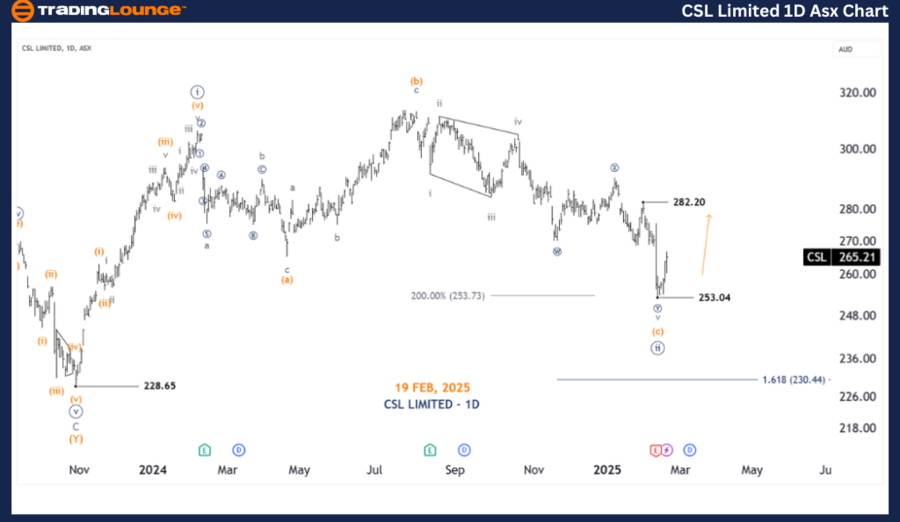
One-day chart (semilog scale) analysis

  • Function: Major Trend (Minute Degree, Navy).

  • Mode: Motive.

  • Structure: Impulse.

  • Position: Wave ((iii)) - Navy.

  • Details:

    • Wave ((ii)) - Navy is forming a Flat (a)(b)(c) - Orange, indicating potential completion.

    • For confirmation, wave ((iii)) - Navy must push above 282.20 to validate the bullish outlook.

  • Invalidation point: 282.20.

  • Confirmation point: 282.20.

Chart

ASX: CSL Elliott Wave technical analysis – TradingLounge

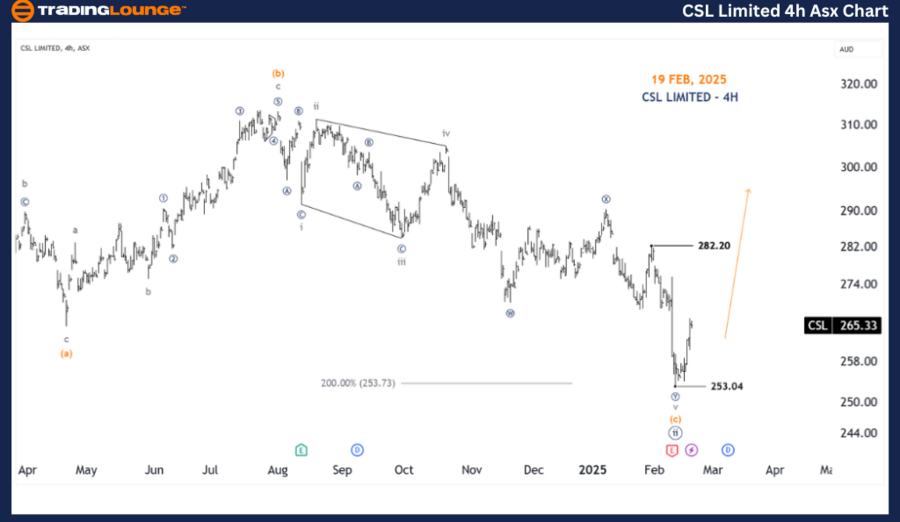
Four-hour chart analysis

  • Function: Major Trend (Minute Degree, Navy).

  • Mode: Motive.

  • Structure: Impulse.

  • Position: Wave ((iii)) - Navy.

  • Details:

    • The ((ii)) - Navy wave ended at 253.04.

    • A ((iii)) - Navy wave may be emerging from this level.

    • Key Breakout Level: A move above 282.20 would confirm the bullish outlook and signal strong upside potential.

  • Invalidation point: 253.04.

Chart

Conclusion

Our analysis and forecast offer a comprehensive perspective on ASX: CSL LIMITED (CSL). We identify market trends, key price levels, and potential entry points to help traders make informed decisions.

By providing specific price points as validation or invalidation signals, we enhance the confidence in our wave count. Combining these technical elements, our goal is to present an objective and professional outlook on CSL’s market trends.

CSL Limited Elliott Wave technical forecast [Video]

Author

Peter Mathers

Peter Mathers

TradingLounge

Peter Mathers started actively trading in 1982. He began his career at Hoei and Shoin, a Japanese futures trading company.

More from Peter Mathers
Share:

Markets move fast. We move first.

Orange Juice Newsletter brings you expert driven insights - not headlines. Every day on your inbox.

By subscribing you agree to our Terms and conditions.

Editor's Picks

EUR/USD: Bulls pray for a dovish Fed

EUR/USD has finally taken a breather after a pretty energetic climb. The pair broke above 1.1680 in the second half of the week, reaching its highest levels in around two months before running into some selling pressure. Even so, it has gained almost two cents from the late-November dip just below 1.1500 the figure.

GBP/USD trims gains, recedes toward 1.3320

GBP/USD is struggling to keep its daily advance, coming under fresh pressure and retreating to the 1.3320 zone following a mild bullish attempt in the Greenback. Even though US consumer sentiment surprised to the upside, the US Dollar isn’t getting much love, as traders are far more interested in what the Fed will say next week.

Gold: Bullish momentum fades despite broad USD weakness

After rising more than 3.5% in the previous week, Gold has entered a consolidation phase and fluctuated at around $4,200. The Federal Reserve’s interest rate decision and revised Summary of Economic Projections, also known as the dot plot, could trigger the next directional move in XAU/USD. 

Week ahead: Rate cut or market shock? The Fed decides

Fed rate cut widely expected; dot plot and overall meeting rhetoric also matter. Risk appetite is supported by Fed rate cut expectations; cryptos show signs of life. RBA, BoC and SNB also meet; chances of surprises are relatively low. Dollar weakness could linger; both the aussie and the yen best positioned to gain further. Gold and oil eye Ukraine-Russia developments; a peace deal remains elusive.

The Silver disconnection is real

Silver just hit a new all-time high. Neither did gold, nor mining stocks. They all reversed on an intraday basis, but silver’s move to new highs makes it still bullish overall, while the almost complete reversals in gold and miners make the latter technically bearish.

Ripple faces persistent bear risks, shrugging off ETF inflows

Ripple is extending its decline for the second consecutive day, trading at $2.06 at the time of writing on Friday. Sentiment surrounding the cross-border remittance token continues to lag despite steady inflows into XRP spot ETFs.