|

Crude Oil struggles to pick a direction as geopolitical tensions and rebel attacks mire the outlook

  • WTI cycles in red territory on Monday, stuck near $72.50.
  • Crude Oil fundamentals continue to soften, global production continues unabated.
  • Houthi rebels continue to hamper supply lines between Europe and Asia.

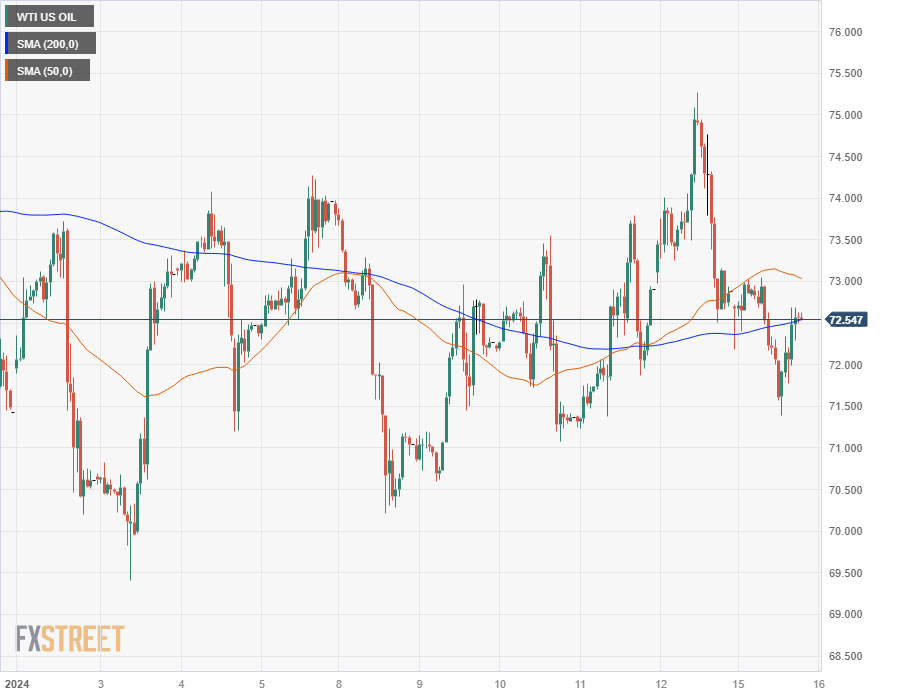
West Texas Intermediate (WTI) US Crude Oil saw weakness in early Monday trading, falling to a near-term low of $71.40 before rebounding to $72.50 following a fresh rocket attack on a civilian cargo ship by Iran-backed Houthi rebels in Yemen. The Houthis, a religious extremist organization with strong ties to Tehran, who recognize the Houthis as the official Yemeni government.

Ongoing energy market concerns continue to fret about potential supply chain disruptions, and the potential for production cuts from the Organization of the Petroleum Exporting Countries to take a bite out of global energy markets’ ability to meet fossil fuel demand, but record Crude Oil production from key non-OPEC countries such as the US and a massive buildup in petroleum gasoline and other Crude Oil derivatives are hampering barrel traders’ efforts to drive up Crude Oil costs.

The American Petroleum Institute (API) will be delivering their latest Weekly Crude Oil Stock counts for the week ended January 12th on Wednesday, followed by the Energy Information Administration’s (EIA) Natural Gas Storage and Crude Oil Stocks Change on Thursday.

WTI Technical Outlook

US Crude Oil has seen rough intraday trading in 2024, with barrel prices cycling in a rough channel between $74.00 and $70.50 as near-term price action sticks close to the 200-hour Simple Moving Average (SMA) near $72.50.

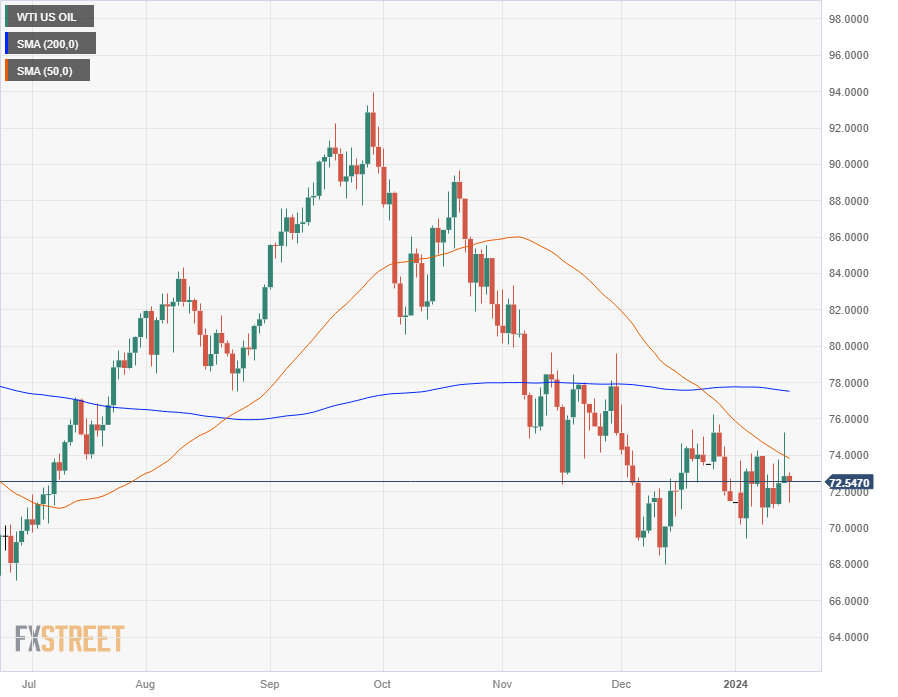
Daily candlesticks have WTI consolidating on the south side of the 200-day SMA at the $78.00 handle, with a descending 50-day SMA building out a technical ceiling and applying downside pressure to near-term price action from $74.00.

WTI Hourly Chart
WTI Daily Chart
WTI Technical Levels

WTI US OIL

Overview
Today last price72.55
Today Daily Change-0.30
Today Daily Change %-0.41
Today daily open72.85
 
Trends
Daily SMA2072.83
Daily SMA5074
Daily SMA10080
Daily SMA20077.56
 
Levels
Previous Daily High75.28
Previous Daily Low72.48
Previous Weekly High75.28
Previous Weekly Low70.21
Previous Monthly High76.79
Previous Monthly Low67.97
Daily Fibonacci 38.2%74.21
Daily Fibonacci 61.8%73.55
Daily Pivot Point S171.79
Daily Pivot Point S270.74
Daily Pivot Point S368.99
Daily Pivot Point R174.59
Daily Pivot Point R276.34
Daily Pivot Point R377.39

Author

Joshua Gibson

Joshua joins the FXStreet team as an Economics and Finance double major from Vancouver Island University with twelve years' experience as an independent trader focusing on technical analysis.


More from Joshua Gibson
Share:

Editor's Picks

AUD/USD extends the range play above 0.7200 as traders await US inflation data

AUD/USD is seen extending its consolidative price move above 0.7200 during the Asian session on Thursday amid mixed cues. Rising RBA rate-hike bets keep the Aussie close to its highest level since May 14. However, hawkish Fed expectations and escalating US-Iran tensions offer some support to the US Dollar, capping the currency pair as traders await US inflation figures.


USD/JPY consolidates around 153.50 as bears turn cautious ahead of US inflation

USD/JPY stabilizes above 153.50 during the Asian session on Thursday, but remains near a seven-month low set earlier this week as hawkish BoJ repricing continues to underpin the Japanese Yen. Meanwhile, rising September Fed rate-hike bets and escalating US-Iran tensions help ease US Dollar selling pressure, offering some support to the currency pair ahead of US inflation figures.

Gold sticks to gains, eyes $4,450 as USD remains depressed ahead of US inflation data

Gold turns higher following an intraday dip to sub-$4,400 levels, and moves further away from a one-week low touched the previous day. The commodity, however, remains below the $4,450 pivotal point as bulls seem hesitant ahead of US inflation figures. The US Producer Price Index report will be published later today, while the US Consumer Price Index is due on Friday.

XRP rally cools, XLM heads toward a make-or-break support
Ripple (XRP) and Stellar (XLM) trade under pressure on Thursday after losing over 2% and 3% so far this week. XRP and XLM are both nearing their crucial support zones, which could determine the next directional move. Meanwhile, mixed derivatives and on-chain data suggest upside potential remains limited for both altcoins. CryptoQuant’s summary data shows cautious signs for both altcoins.
Jobs opened the door for the Fed — inflation decides whether it walks through

The latest US jobs report did not end the debate over the Federal Reserve’s (Fed) next move. It may have done something more subtle: it gave policymakers permission to keep their options open. After months of softer labour market signals, August delivered a stronger-than-expected rebound.

Venezuela’s 65-billion-barrel Oil deal could reshape America’s inflation fight
The United States (US) has secured unprecedented access to part of Venezuela’s vast Oil reserves. The timing is particularly significant as the war with Iran is disrupting Middle Eastern supplies, keeping energy prices elevated and reviving concerns about inflation.