Crude Oil staggers after surprise buildup in barrel counts, WTI retests $72
- Crude Oil took a hit on Wednesday after EIA crude stocks climbed again.
- Downstream oil products also rose significantly.
- Middle East complications continue to prop up Crude Oil on supply concerns.

West Texas Intermediate (WTI) US Crude Oil slipped from a fresh daily high after the Energy Information Administration (EIA) released their updated US Crude Oil stocks numbers, revealing another buildup of Crude Oil barrels, as well as burgeoning numbers of oil derivative products in supply lines.
Crude Oil prices popped early Wednesday after it was reported that Iran-backed Houthi rebels in Iran launched their largest wave of attacks to-date on civilian cargo ships in the waterways leading towards the Suez Canal. Houthis launched a combination of 21 drones and missiles at shipping vessels in the key waterway that connects supply lines between Europe and Asia.
No damage was reported and coalition naval forces from the US and the UK reported 100% destruction of all Houthi weapons that were in transit at the time. According to reporting by the BBC, citing US military sources, Houthi rebels in Yemen have carried out 26 attacks on commercial shipping vessels since November 19.
Despite the successful fending off of further rebel attacks, Crude Oil caught a fear-based bid as energy markets continue to fret about the possibility of conflicts hampering global trade in oil barrels. WTI climbed to $73.55 before getting knocked back once again after the EIA released their Crude Oil barrel counts for the week ended January 5, showing another buildup in both Crude Oil barrels and downstream oil derivatives.
According to the EIA, US Crude Oil Stocks climbed 1.338 million barrels versus the forecast 675K decline, taking a bite out of the previous week’s 5.5 million barrel decline.
Gasoline reserves also climbed well above expectations, adding a further 8.29 million barrels vs the expected 2.489 million. Oil Distillates also climbed 6.528 million versus the forecast 2.382 million uptick. The EIA also estimates that US Crude Oil production remained above 13 million barrels per day.
WTI Technical Outlook
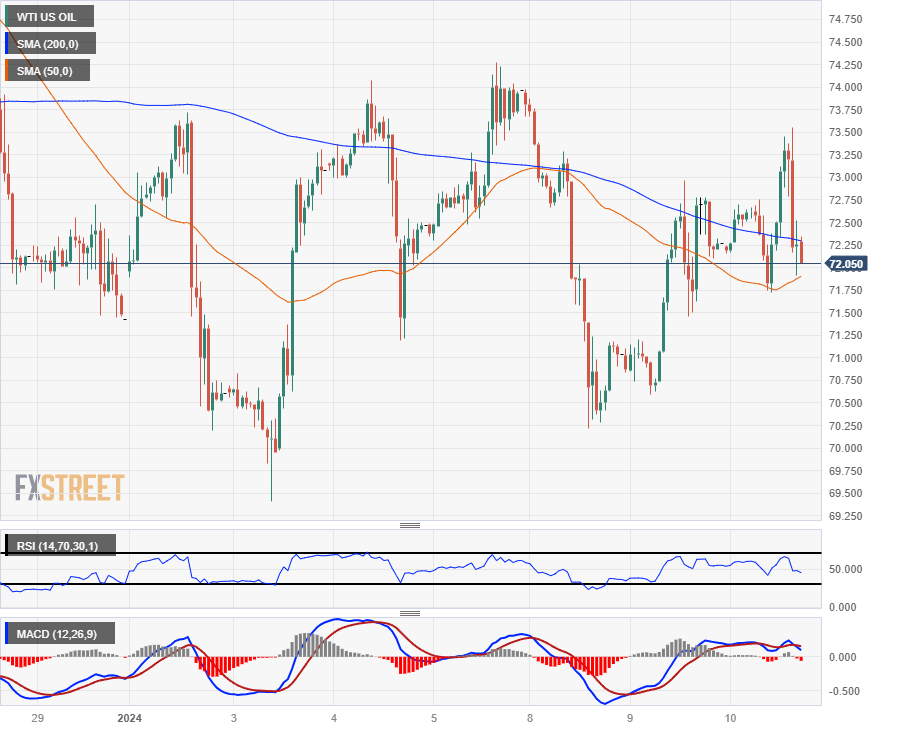
WTI US Crude Oil stumbled back from Wednesday’s peak bids near $73.60 to retest the $72.00 handle as bids continue to get hampered by the 200-hour Simple Moving Average (SMA). Rough chop on the intraday level continues to be the name of the game, with WTI prices whipsawing in a rough range in the early weeks of 2024.
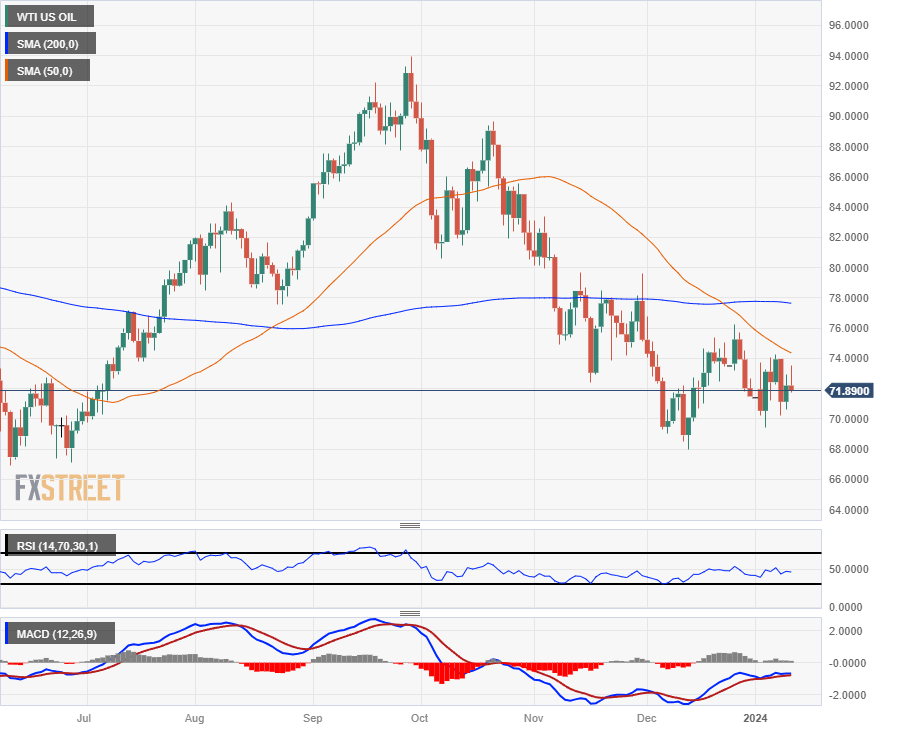
Daily candlesticks have WTI pressured into the low side, with near-term price action capped by a declining 50-day SMA with a technical ceiling priced in at the 200-day SMA near $78.00.
Technical momentum has drained out of the WTI chart as technical indicators drift into the midrange, and US Crude Oil remains down nearly 24% from last September’s top bids near $94.00.
WTI Hourly Chart
WTI Daily Chart
WTI Technical Levels
Author

Joshua Gibson
FXStreet
Joshua joins the FXStreet team as an Economics and Finance double major from Vancouver Island University with twelve years' experience as an independent trader focusing on technical analysis.


