Crude Oil rose again on Wednesday, but WTI found friction at $79.00
- EIA reported another Crude Oil inventory build.
- The API also reported an increase in barrel counts late Tuesday.
- OPEC officially weighs extending Q1 production caps through Q2.
West Texas Intermediate (WTI) US Crude Oil found further room on the top end on Wednesday, briefly climbing above $79.00 before getting pulled back down by another surprise buildup in US Crude Oil inventories according to the Energy Information Administration (EIA). The EIA’s uptick in barrel counts adds to another reported buildup from the American Petroleum Institute (API) which came through late Tuesday.
According to the EIA, US Crude Stocks Change for the week ended February 23 rose 4.199 million barrels, above the 2.743 million forecast and adding to the previous week’s 3.514 million buildup. This also adds to the API Weekly Crude Oil Stock count for the same period, which added another 8.428 million barrels compared to the previous week’s 7.168 million.
With inventories on the rise, the Organization of the Petroleum Exporting Countries (OPEC) has extended the first quarter’s production caps through June, and the Crude Oil cartel is formally weighing extending pumping reductions through the second quarter. The consortium is trying to bolster Crude prices by stemming the tide of Crude Oil supply getting pumped into markets by non-OPEC countries, specifically the US which recently became the single largest exporter of Crude Oil to Europe.
WTI technical outlook
WTI briefly tested into its highest prices since late November, etching in a daily high of $79.27 before falling back into the low end for Wednesday.
WTI continues to run aground of the 200-day Simple Moving Average (SMA) at $77.67. US Crude Oil is struggling to develop further bullish momentum, but is still up around 9% from the last swing low into $72.00 in early February.
WTI hourly chart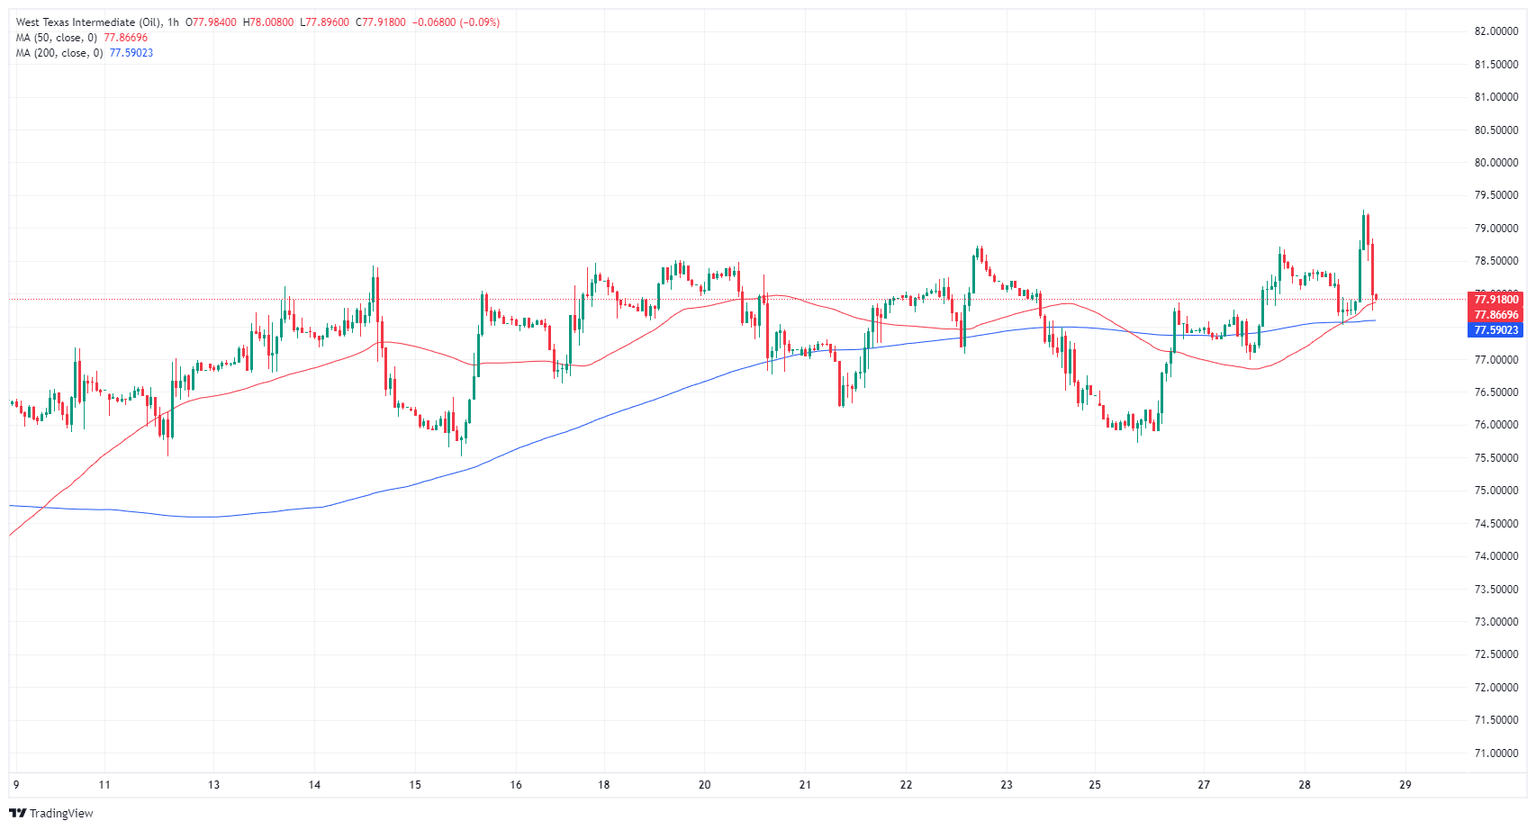
WTI daily chart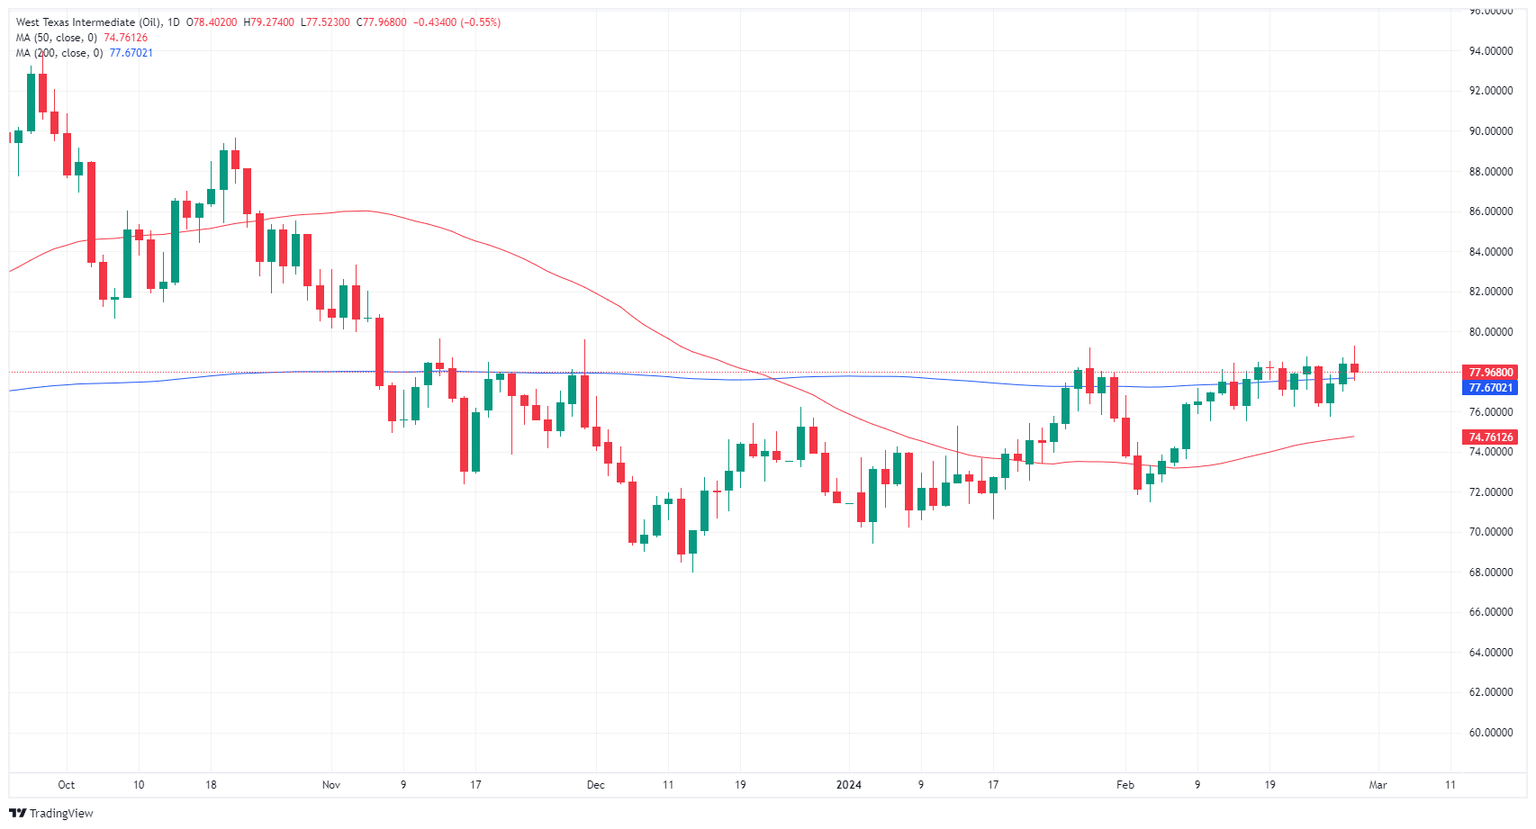
Author

Joshua Gibson
FXStreet
Joshua joins the FXStreet team as an Economics and Finance double major from Vancouver Island University with twelve years' experience as an independent trader focusing on technical analysis.


