Crude Oil recedes further, WTI falls below $78 on rising supplies and cautious FOMC
- WTI declines for a third straight day on Wednesday.
- US barrel counts hint at further supply overhang.
- FOMC Meeting Minutes reveal cautious Fed, rate hopes stumble.

West Texas Intermediate (WTI) US Crude Oil declined for a third straight day on Wednesday, falling below $78.00 per barrel once again after US Crude Oil barrel counts rose week-on-week after a previous decline. The Federal Reserve’s (Fed) latest Meeting Minutes revealed the Federal Open Market Committee (FOMC) remains stubbornly committed to waiting for firmer signs that US inflation will continue easing towards the Fed’s 2% annual target, vexing rate cut hopes and knocking risk sentiment lower in the midweek market session.
Read more: Fed Minutes leave the door open to a probable rate cut in September
According to the Energy Information Administration (EIA), US Crude Oil Stocks through the week ended May 17, climbing 1.825 million barrels, well above the median market forecast of a -3.1 million barrel decline. The week-on-week EIA barrel count chewed through most of the previous week’s -2.508 million barrel drop, reigniting concerns that US Crude Oil production threatens to swamp demand.
Crude Oil over-production concerns rose further on Wednesday after Russia announced an accidental overproduction of Russian Crude, with the nation pointing a finger at “technical difficulties”. According to sources, Russia’s Energy Minister will be putting options for voluntary output cuts “under review. Russia is expected to present a plan to offset additional production to OPEC+, the extended group of associate states aligned with the inner core of the Organization of the Petroleum Exporting Countries (OPEC).
WTI technical outlook
WTI US Crude Oil is testing down into $77.00 per barrel, extending a near-term decline from a recent peak just above $80.00 per barrel. Intraday price action has tumbled back into a familiar demand zone below $78.00 per barrel, and risks further downside if it breaks down below $76.50.
WTI closed in the red for a third consecutive trading day on Wednesday, increasing the odds of an extended technical rejection from the 200-day Exponential Moving Average (EMA) at $79.25.
WTI hourly chart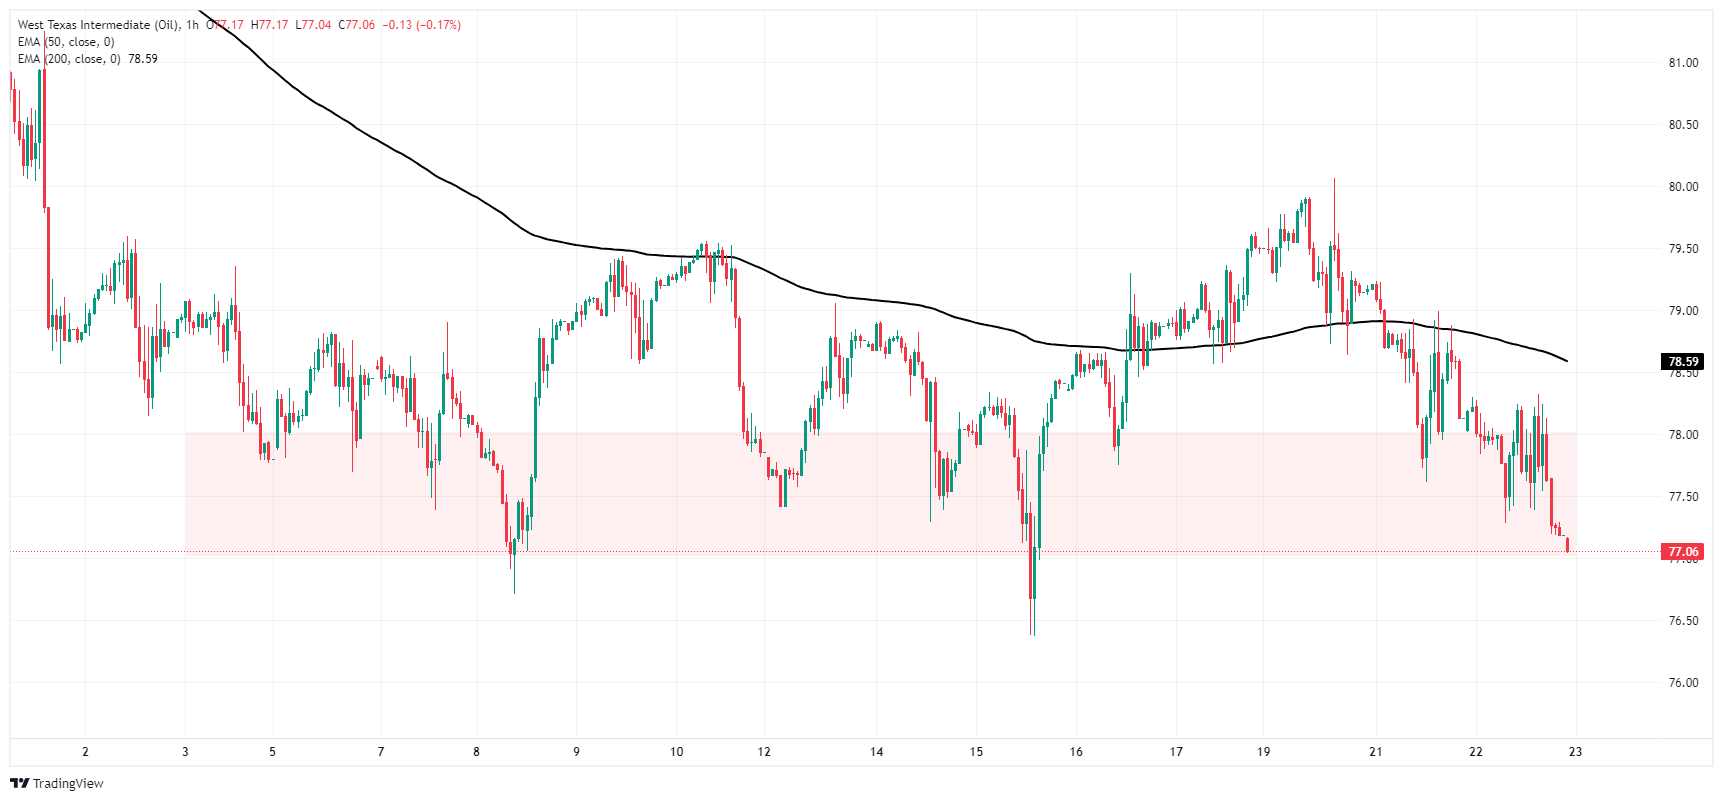
WTI daily chart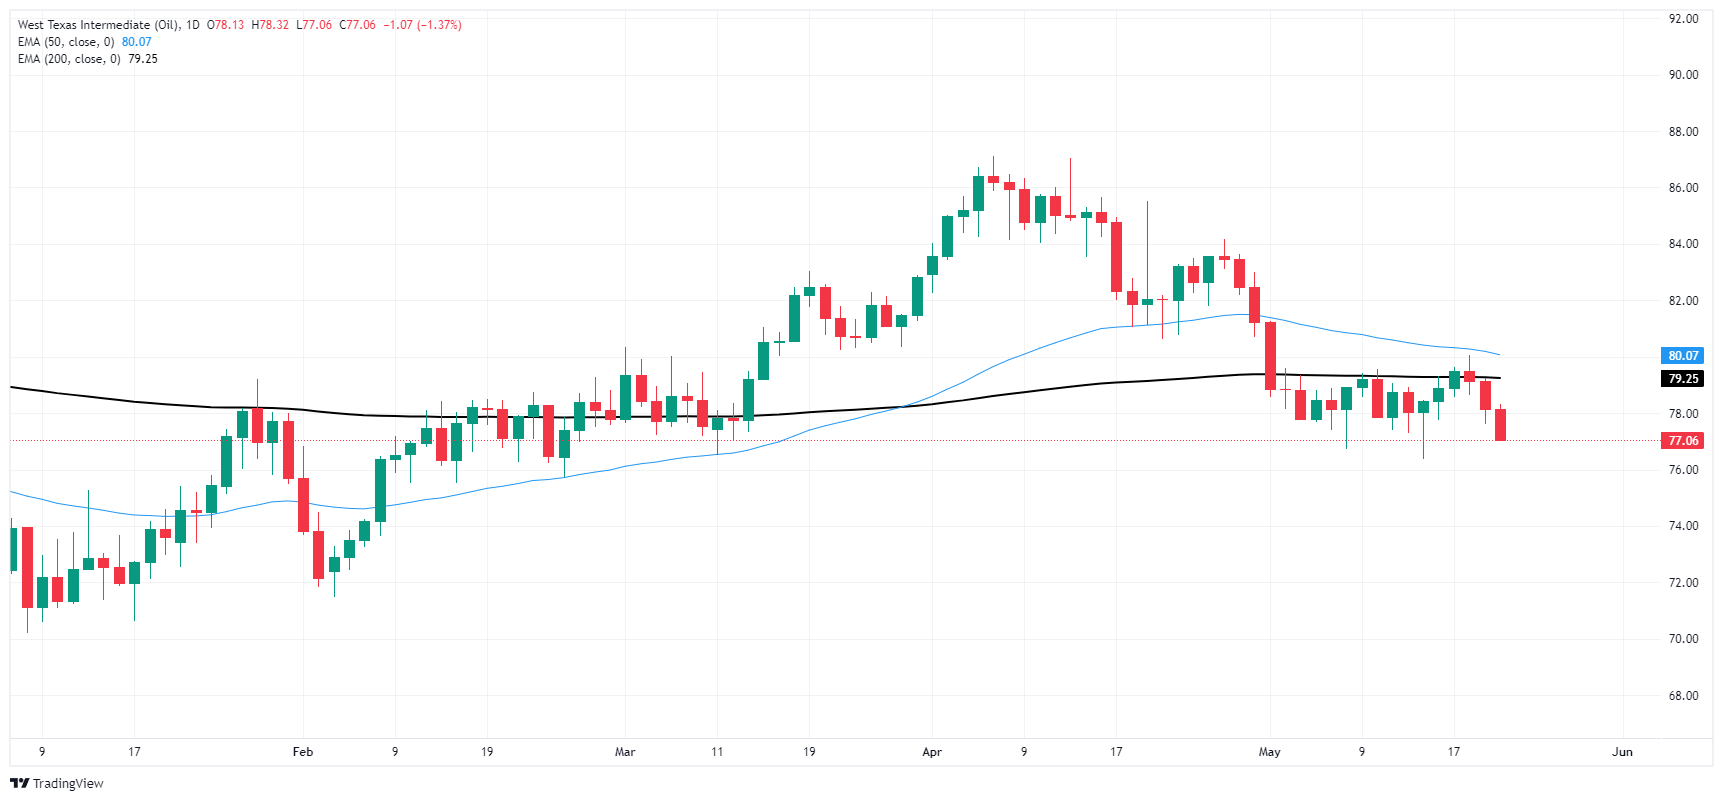
Author

Joshua Gibson
FXStreet
Joshua joins the FXStreet team as an Economics and Finance double major from Vancouver Island University with twelve years' experience as an independent trader focusing on technical analysis.


