Crude Oil extends rally, WTI crosses above $82.00


  • Crude Oil prices are continuing a bull run on Monday.
  • WTI is breaking out on the bull side as supply constraint concerns weigh.
  • US Crude Oil bids into its highest prices since November.

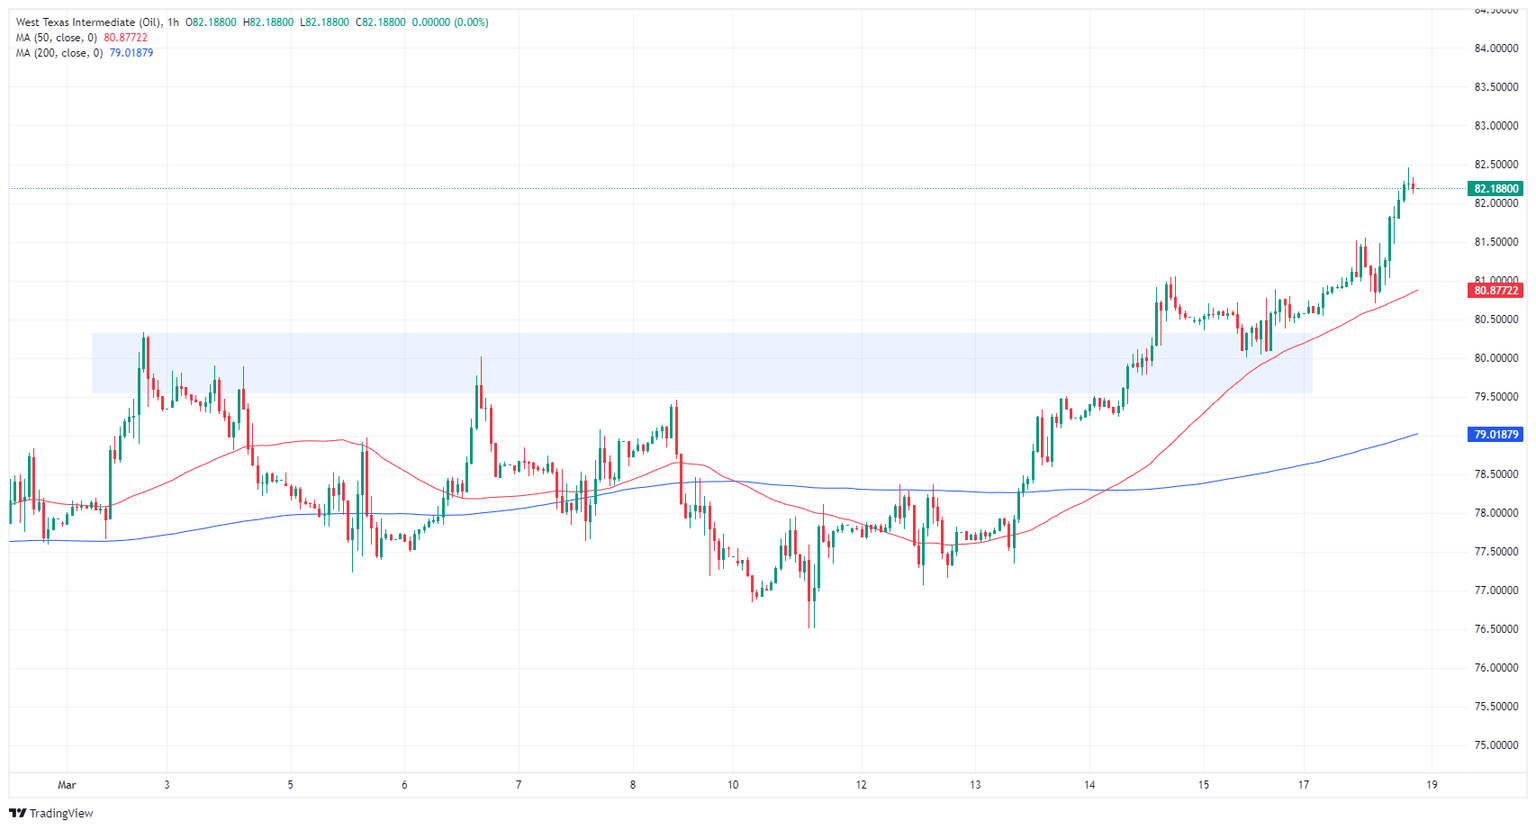
West Texas Intermediate (WTI) US Crude Oil climbed over $82.00 per barrel on Monday, extending a near-term bull. US Crude Oil tested its highest barrel prices since November, hitting a 16-week high of $82.46 to kick off the new trading week.

Energy markets are increasingly concerned that declining Crude Oil supplies will continue into the immediate future. Despite record oil pumping amounts from countries outside of the Organization of the Petroleum Exporting Countries (OPEC), specifically the US, Crude Oil markets are broadly expected to see a medium-term to long-term supply constraint, bumping barrel costs higher.

Weekly Crude Oil Stocks for the week ended March 15 from the American Petroleum Institute (API) are due Tuesday, and last showed a -5.5 million barrel drawdown. The Energy Information Administration’s (EIA) own Crude Oil Stocks Change is due Wednesday. The EIA’s barrel counts are expected to be further drawn down by a scant 25K barrels after the previous week’s decline of -1.5 million.

WTI technical outlook

Monday’s bullish bounce sees WTI trading above the $82.00 handle after catching a rebound from a previous supply zone near $80.00 per barrel. Crude Oil has gained nearly 7.5% from the last swing low below $77.00.

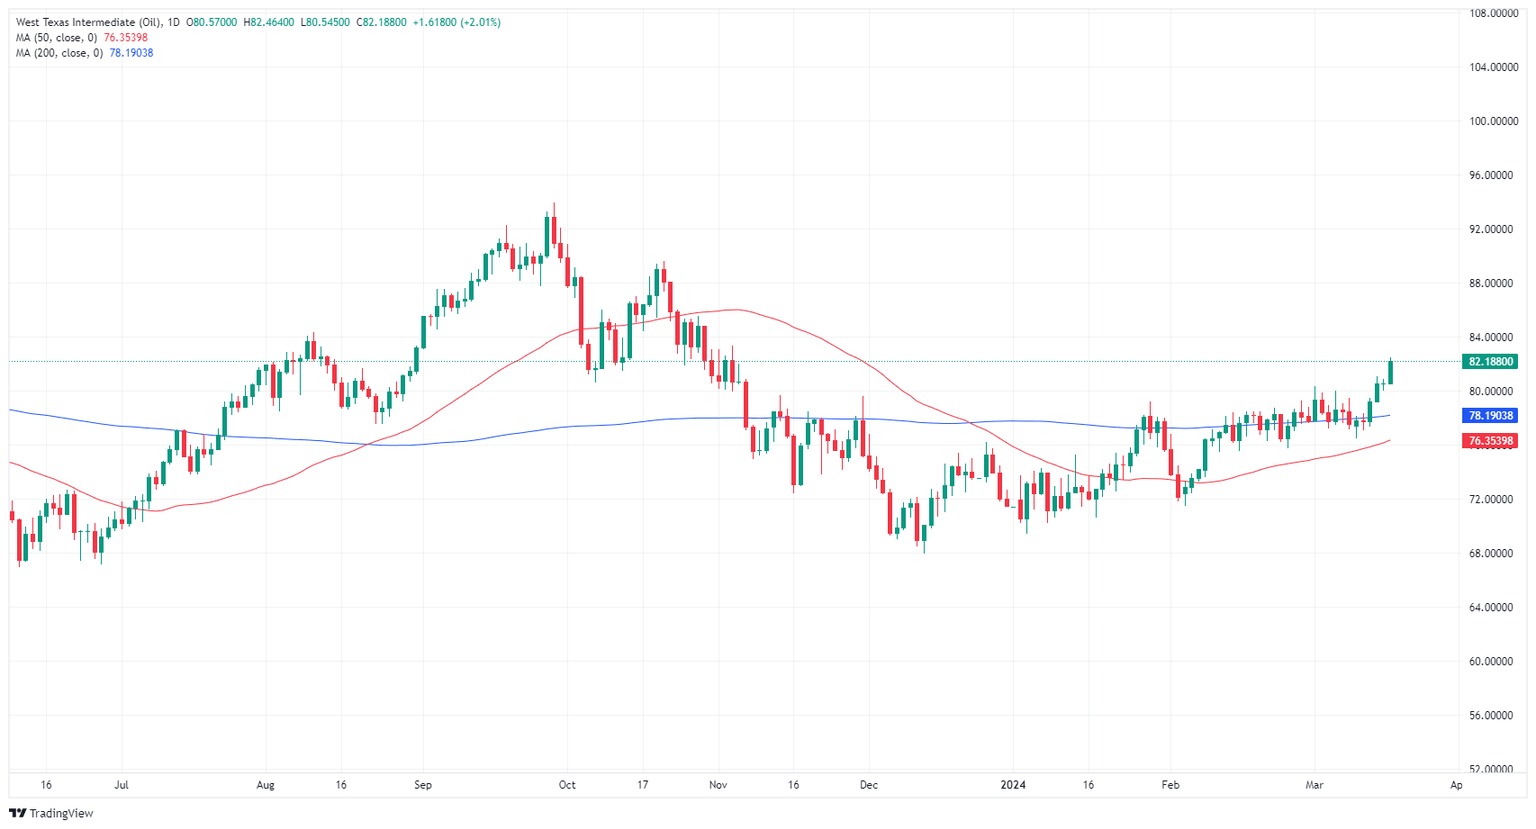
Monday’s bullish extension adds further topside momentum to a technical recovery on daily candlesticks after WTI US Crude Oil bottomed out near $67.85.

WTI hourly chart
WTI daily chart
WTI US OIL

Overview
Today last price 82.19
Today Daily Change 1.62
Today Daily Change % 2.01
Today daily open 80.57
 
Trends
Daily SMA20 78.28
Daily SMA50 76.13
Daily SMA100 75.54
Daily SMA200 78.12
 
Levels
Previous Daily High 80.88
Previous Daily Low 80.01
Previous Weekly High 81.05
Previous Weekly Low 76.5
Previous Monthly High 79.27
Previous Monthly Low 71.46
Daily Fibonacci 38.2% 80.55
Daily Fibonacci 61.8% 80.34
Daily Pivot Point S1 80.09
Daily Pivot Point S2 79.61
Daily Pivot Point S3 79.21
Daily Pivot Point R1 80.97
Daily Pivot Point R2 81.36
Daily Pivot Point R3 81.84


Share: Feed news

Information on these pages contains forward-looking statements that involve risks and uncertainties. Markets and instruments profiled on this page are for informational purposes only and should not in any way come across as a recommendation to buy or sell in these assets. You should do your own thorough research before making any investment decisions. FXStreet does not in any way guarantee that this information is free from mistakes, errors, or material misstatements. It also does not guarantee that this information is of a timely nature. Investing in Open Markets involves a great deal of risk, including the loss of all or a portion of your investment, as well as emotional distress. All risks, losses and costs associated with investing, including total loss of principal, are your responsibility. The views and opinions expressed in this article are those of the authors and do not necessarily reflect the official policy or position of FXStreet nor its advertisers. The author will not be held responsible for information that is found at the end of links posted on this page.

If not otherwise explicitly mentioned in the body of the article, at the time of writing, the author has no position in any stock mentioned in this article and no business relationship with any company mentioned. The author has not received compensation for writing this article, other than from FXStreet.

FXStreet and the author do not provide personalized recommendations. The author makes no representations as to the accuracy, completeness, or suitability of this information. FXStreet and the author will not be liable for any errors, omissions or any losses, injuries or damages arising from this information and its display or use. Errors and omissions excepted.

The author and FXStreet are not registered investment advisors and nothing in this article is intended to be investment advice.

Recommended content


Recommended content

Editors’ Picks

AUD/USD remains heavy toward 0.6400 as RBA Bullock's presser gets underway

AUD/USD remains heavy toward 0.6400 as RBA Bullock's presser gets underway

AUD/USD stays under heavy selling pressure and eyes 0.6400 in early Europe on Tuesday. The RBA cut interest rate by 25 bps to 3.85% and trimmed inflation and growth forecast on US tariffs impact, as expected. Governor Bullock's speaks on policy outlook at the press conference. 

EUR/USD tests descending channel’s upper boundary near 1.1250

EUR/USD tests descending channel’s upper boundary near 1.1250

EUR/USD remains steady after registering more than 0.50% gains in the previous session, trading around 1.1240 during the Asian hours on Tuesday. On the daily chart, technical analysis indicates a bearish bias is in play, as the pair continues to trade lower within a descending channel pattern.

Gold price sticks to intraday losses amid positive risk tone; holds above $3,200

Gold price sticks to intraday losses amid positive risk tone; holds above $3,200

Gold price maintains its offered tone through the Asian session on Tuesday though it manages to hold above the $3,200 round figure. Against the backdrop of rising trade optimism, hopes for a Russia-Ukraine ceasefire remain supportive of a positive risk tone.

Solana set for a consensus switch with the introduction of Alpenglow

Solana set for a consensus switch with the introduction of Alpenglow

Solana (SOL) showed signs of recovery in the American trading session on Monday following the introduction of a new consensus protocol, Alpenglow, which would replace the network's current Proof-of-History and TowerBFT mechanisms. 

China April slowdown shows the impact of economic uncertainty

China April slowdown shows the impact of economic uncertainty

Trade war uncertainty is denting Chinese confidence, resulting in slower economic activity in April. Retail sales and fixed-asset investment both underperformed forecasts amid heightened caution. Yet the impact on manufacturing was less than feared.

The Best brokers to trade EUR/USD

The Best brokers to trade EUR/USD

SPONSORED Discover the top brokers for trading EUR/USD in 2025. Our list features brokers with competitive spreads, fast execution, and powerful platforms. Whether you're a beginner or an expert, find the right partner to navigate the dynamic Forex market.

Forex MAJORS

Cryptocurrencies

Signatures

Best Brokers of 2025