|

Could Amazon (AMZN Stock) move to its 52-week low?

Today’s instrument is the Amazon.com‘s stock traded in Nasdaq exchange under the ticker AMZN.

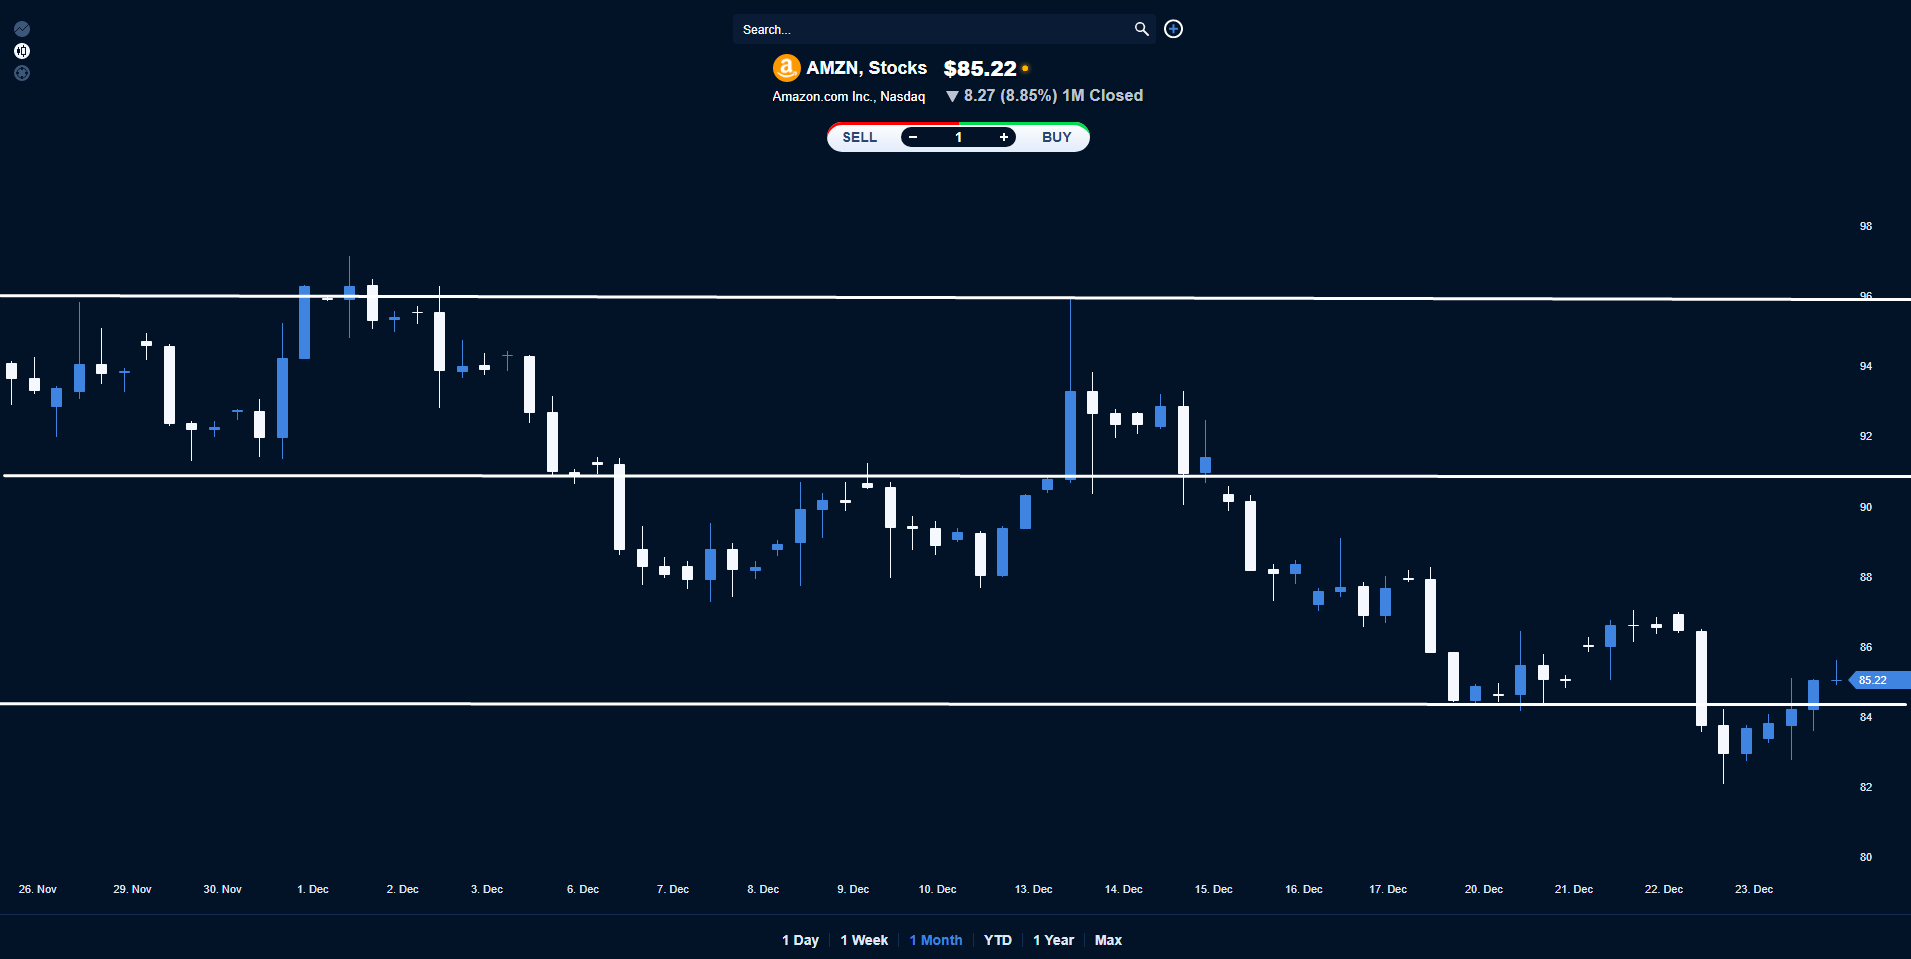
Looking at the AMZN‘s chart, we can see that it has been in a downtrend reaching the 52W low at $82.25 and it was lastly traded at around $85.25.

Today, if it holds above the support level of $84.50, we should expect it to upwardly react towards its soft resistance level at around $87 and if it manages to break through it, then it could approach its next resistance level at around $92.50. 

On the other hand, it could be possible for it to reach a new 52W low.

Chart

Risk Warning for Intraday Technical Analysis: Trading is risky. Information presented herein, is not to be constructed as a solicitation or an offer to buy or sell any Financial Instrument or to participate in any particular trading strategy. Amazon.com inc. logo and any associated brand names are Amazon.com inc. trademarks. All other trademarks are property of their respective owners.

Author

AAATrade Team

The AAATrade Team has extensive experience in content writing for the financial industry. Stelios Nikolaou is the lead writer of the team, he currently works at AAATrade to provide research and content writing services.

More from AAATrade Team
Share:

Markets move fast. We move first.

Orange Juice Newsletter brings you expert driven insights - not headlines. Every day on your inbox.

By subscribing you agree to our Terms and conditions.

Editor's Picks

EUR/USD could test 1.1750 amid strengthening bullish bias

EUR/USD remains flat after two days of small losses, trading around 1.1740 during the Asian hours on Thursday. On the daily chart, technical analysis indicates a strengthening of a bullish bias, as the pair continues to trade within an ascending channel pattern.

GBP/USD consolidates above mid-1.3300s as traders await BoE and US CPI report

The GBP/USD pair struggles to capitalize on the overnight bounce from the 1.3310 area, or a one-week low, and oscillates in a narrow band during the Asian session on Thursday. Spot prices currently trade around the 1.3370 region, down less than 0.10% for the day, as traders opt to wait on the sidelines ahead of the key central bank event risk and US consumer inflation data.

Gold awaits weekly trading range breakout ahead of US CPI report

Gold struggles to capitalize on the previous day's move higher back closer to the $4,350 level and trades with a mild negative bias during the Asian session on Thursday. The downtick could be attributed to some profit-taking amid a US Dollar uptick, though it is likely to remain cushioned on the back of a supportive fundamental backdrop. 

Dogecoin breaks key support amid declining investor confidence

Dogecoin trades in the red on Thursday, following a 4% decline on the previous day. The DOGE supply in profit declines as large wallet investors trim their portfolios. Derivatives data shows a surge in bearish positions amid declining retail interest.

Monetary policy: Three central banks, three decisions, the same caution

While the Fed eased its monetary policy on 10 December for the third consecutive FOMC meeting, without making any guarantees about future action, the BoE, the ECB and the BoJ are holding their respective meetings this week. 

Dogecoin Price Forecast: DOGE breaks key support amid declining investor confidence

Dogecoin (DOGE) trades in the red on Thursday, following a 4% decline on the previous day. The DOGE supply in profit declines as large wallet investors trim their portfolios. Derivatives data shows a surge in bearish positions amid declining retail interest.