Continental is a German multinational automotive parts manufacturing company. It is specializing in brake systems, interior electronics, tachographs, automotive safety, powertrain and chassis components, tires and other parts for the automotive and transportation industries.  Founded in 1871 and headquartered in Hanover, Germany, Continental is a part of DAX40 index. From the all-time lows, the stock price is showing a series of nests. It is expected to accelerate higher towards the new all-time highs. In the initial article one year ago, we have forecasted the acceleration higher to happen. We were right. Now, a pullback provides an opportunity for even more upside.

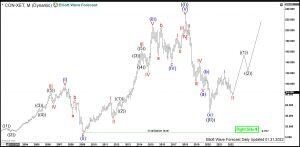
Continental Monthly Elliott Wave Analysis 01.31.2022

The monthly chart below shows the Coninental stock $CON traded at XETRA. From the all-time lows, Continental has developed a cycle higher in black wave ((I)) of a grand super cycle degree. It has printed the the all-time highs on January 2018 at 228.89. Hereby, within the impulsive advance, all the subwaves (I), (III) and (V) are impulsive waves, too. Wave (III) demonstrates a clear extension in price.

From the January 2018 highs, a sharp correction in wave ((II)) has retraced more than 78.6% of the rise. It has unfolded as an Elliott wave zigzag pattern being 5-3-5 structure. Hereby, it has bottomed in March 2020 at 45.75. From there, the wave ((III)) might be in first stages and should break to the new all-time highs. The target higher for the wave ((III)) is the 1.0-1.618 extension of the wave ((I)) being 273.94-415.15 area and even higher.

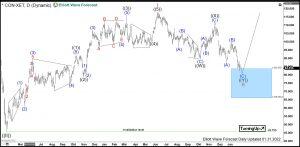
Continental Daily Elliott Wave Analysis 01.31.2022

The daily chart below shows the initial nest consisting of waves I and II. First, from the March 2020 lows at 45.75, a cycle higher in red wave I has unfolded as an impulse. It has printed its top in June 2021 at 117.99. Now, a correction lower in red wave II might be still in progress. While price is trading below 111.96 peak, $CON can still extend deeper into 83.75-66.22 area. There, based on our expectations, a reaction higher in the wave III should take place. While above 82.36, wave III might be already in progress. In that case, the target will be towards 1.0-1.618 extensin of the wave I being 154.73-199.46 area and even beyond.


Share: Feed news

FURTHER DISCLOSURES AND DISCLAIMER CONCERNING RISK, RESPONSIBILITY AND LIABILITY Trading in the Foreign Exchange market is a challenging opportunity where above average returns are available for educated and experienced investors who are willing to take above average risk. However, before deciding to participate in Foreign Exchange (FX) trading, you should carefully consider your investment objectives, level of xperience and risk appetite. Do not invest or trade capital you cannot afford to lose. EME PROCESSING AND CONSULTING, LLC, THEIR REPRESENTATIVES, AND ANYONE WORKING FOR OR WITHIN WWW.ELLIOTTWAVE- FORECAST.COM is not responsible for any loss from any form of distributed advice, signal, analysis, or content. Again, we fully DISCLOSE to the Subscriber base that the Service as a whole, the individual Parties, Representatives, or owners shall not be liable to any and all Subscribers for any losses or damages as a result of any action taken by the Subscriber from any trade idea or signal posted on the website(s) distributed through any form of social-media, email, the website, and/or any other electronic, written, verbal, or future form of communication . All analysis, trading signals, trading recommendations, all charts, communicated interpretations of the wave counts, and all content from any media form produced by www.Elliottwave-forecast.com and/or the Representatives are solely the opinions and best efforts of the respective author(s). In general Forex instruments are highly leveraged, and traders can lose some or all of their initial margin funds. All content provided by www.Elliottwave-forecast.com is expressed in good faith and is intended to help Subscribers succeed in the marketplace, but it is never guaranteed. There is no “holy grail” to trading or forecasting the market and we are wrong sometimes like everyone else. Please understand and accept the risk involved when making any trading and/or investment decision. UNDERSTAND that all the content we provide is protected through copyright of EME PROCESSING AND CONSULTING, LLC. It is illegal to disseminate in any form of communication any part or all of our proprietary information without specific authorization. UNDERSTAND that you also agree to not allow persons that are not PAID SUBSCRIBERS to view any of the content not released publicly. IF YOU ARE FOUND TO BE IN VIOLATION OF THESE RESTRICTIONS you or your firm (as the Subscriber) will be charged fully with no discount for one year subscription to our Premium Plus Plan at $1,799.88 for EACH person or firm who received any of our content illegally through the respected intermediary’s (Subscriber in violation of terms) channel(s) of communication.

Recommended content


Recommended content

Editors’ Picks

AUD/USD failed just ahead of the 200-day SMA

AUD/USD failed just ahead of the 200-day SMA

Finally, AUD/USD managed to break above the 0.6500 barrier on Wednesday, extending the weekly recovery, although its advance faltered just ahead of the 0.6530 region, where the key 200-day SMA sits.

AUD/USD News

EUR/USD met some decent resistance above 1.0700

EUR/USD met some decent resistance above 1.0700

EUR/USD remained unable to gather extra upside traction and surpass the 1.0700 hurdle in a convincing fashion on Wednesday, instead giving away part of the weekly gains against the backdrop of a decent bounce in the Dollar.

EUR/USD News

Gold keeps consolidating ahead of US first-tier figures

Gold keeps consolidating ahead of US first-tier figures

Gold finds it difficult to stage a rebound midweek following Monday's sharp decline but manages to hold above $2,300. The benchmark 10-year US Treasury bond yield stays in the green above 4.6% after US data, not allowing the pair to turn north.

Gold News

Bitcoin price could be primed for correction as bearish activity grows near $66K area

Bitcoin price could be primed for correction as bearish activity grows near $66K area

Bitcoin (BTC) price managed to maintain a northbound trajectory after the April 20 halving, despite bold assertions by analysts that the event would be a “sell the news” situation. However, after four days of strength, the tables could be turning as a dark cloud now hovers above BTC price.

Read more

Bank of Japan's predicament: The BOJ is trapped

Bank of Japan's predicament: The BOJ is trapped

In this special edition of TradeGATEHub Live Trading, we're joined by guest speaker Tavi @TaviCosta, who shares his insights on the Bank of Japan's current predicament, stating, 'The BOJ is Trapped.' 

Read more

Forex MAJORS

Cryptocurrencies

Signatures