Coal India Elliott Wave technical analysis [Video]
![Coal India Elliott Wave technical analysis [Video]](https://editorial.fxsstatic.com/images/i/india-01_XtraLarge.jpg)
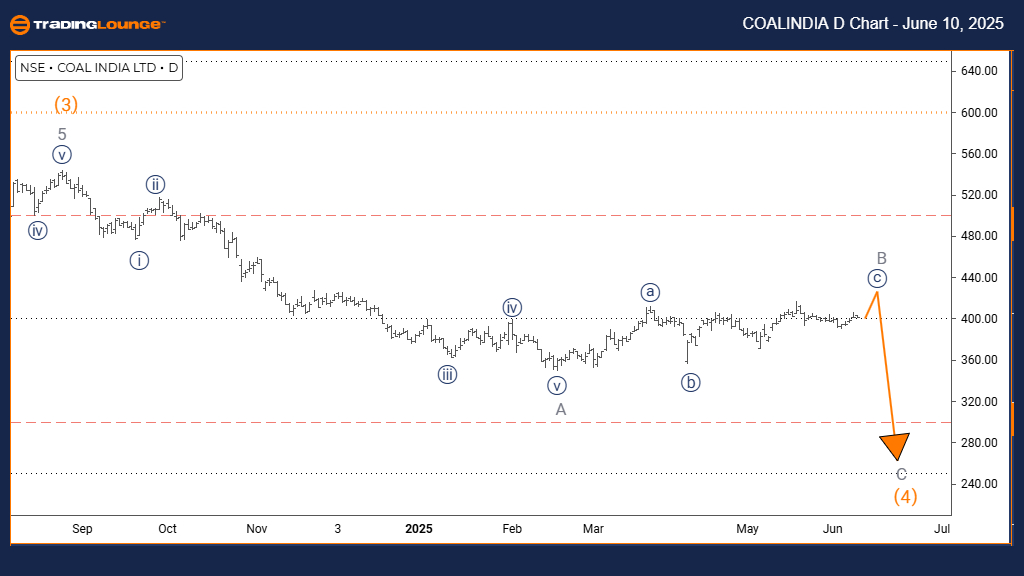
Coal India Elliott Wave analysis – Day chart
Function: Counter Trend.
Mode: Corrective.
Structure: Navy Blue Wave C.
Position: Gray Wave C.
Direction next lower degrees: Gray Wave C.
Details: Navy Blue Wave B appears complete, with Navy Blue Wave C now active.
The daily Elliott Wave analysis for COAL INDIA shows a counter-trend setup. This structure suggests a corrective move, rather than a continuation of the main trend. The pattern is marked as Navy Blue Wave C, unfolding within a broader corrective phase labeled Gray Wave C. This configuration implies the stock is in the final part of a corrective move before possibly resuming its original trend.
With Navy Blue Wave B considered complete, the chart indicates that Navy Blue Wave C is currently progressing within the larger Gray Wave C. This phase typically marks the final leg of a correction and often demonstrates a strong move against the main trend. Traders should focus on tracking Gray Wave C as the current wave setup develops.
The corrective formation implies COAL INDIA may see continued movement against the prevailing trend until Navy Blue Wave C completes. This transition from Wave B to Wave C marks a crucial stage, indicating the correction is nearing its end.
Traders are advised to await signs that this correction is concluding before preparing for any potential trend reversal or continuation. The sequence of multiple corrective waves across degrees reinforces the counter-trend nature of current price action. Watch closely for signs that Navy Blue Wave C has finished within the broader Gray Wave C to identify the next directional move in COAL INDIA.
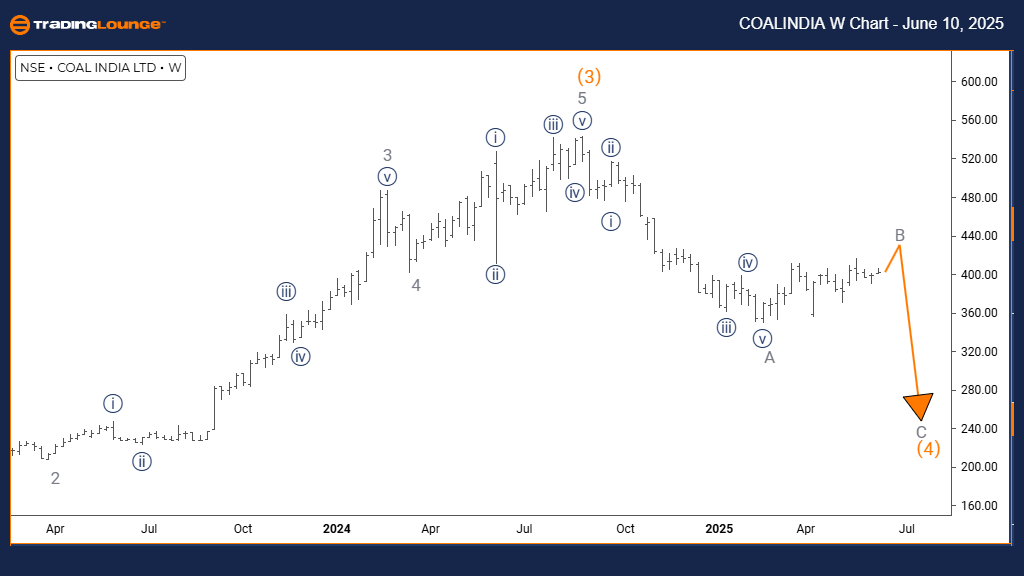
Coal India Elliott Wave analysis – Weekly chart
Function: Counter Trend.
Mode: Impulsive.
Structure: Gray Wave B.
Position: Orange Wave 4.
Direction next lower degrees: Gray Wave C.
Details: Gray Wave A appears complete, with Gray Wave B currently developing.
On the weekly chart, COAL INDIA’s Elliott Wave analysis shows a counter-trend structure characterized by an impulsive move. This move occurs within Gray Wave B, forming part of a broader correction under Orange Wave 4. This suggests a significant counter-trend movement, offering potential trading opportunities opposite to the main trend.
With Gray Wave A now seemingly complete, attention shifts to Gray Wave B, which marks a corrective rally within the wider downtrend. The expected next move, Gray Wave C, would follow the completion of Wave B and might drive prices lower, finishing the overall correction.
The impulsive nature of Gray Wave B indicates possible strong momentum during this phase. COAL INDIA appears to be in a mid-correction position with Gray Wave B currently active.
This setup signals that traders should watch for Gray Wave B’s completion before expecting the initiation of Gray Wave C. The sharp price swings typical of this counter-trend impulse present potential trading setups. Confirmation of Gray Wave B’s conclusion will be key to preparing for the next phase in the sequence—Gray Wave C, likely representing the final corrective move.
Coal India Elliott Wave technical analysis [Video]
Author

Peter Mathers
TradingLounge
Peter Mathers started actively trading in 1982. He began his career at Hoei and Shoin, a Japanese futures trading company.


