Citigroup tests channel ceiling: Will mid-support hold the rally?
Citigroup (C), one of the largest financial institutions in the United States providing banking, credit, and investment services globally, has been riding a remarkably disciplined uptrend since spring. What immediately strikes me about this chart is the textbook nature of the ascending channel that's contained price action for the better part of nine months. Those parallel yellow lines have acted like guardrails on a mountain highway, keeping the rally structured and predictable.
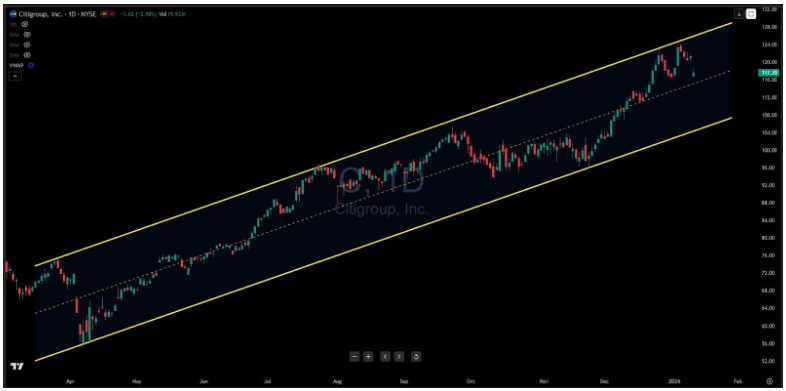
The recent price action tells an interesting story. After climbing steadily through this channel, Citigroup pushed toward $125 in early January, testing the upper boundary of this ascending structure. That's where sellers stepped in with authority, rejecting the advance and sending shares back down toward current levels around $117-118. This isn't necessarily bearish—it's actually quite normal for channeled moves. Think of it as the market taking a breath after stretching too far above its average trajectory.
What matters most right now is how price interacts with the yellow dotted midline support around $116-117. This middle rail has served as a reliable reference point throughout the uptrend, and the additional yellow dashed trendline connecting higher lows sits right in this same zone. That's a confluence of support that experienced traders pay attention to.
For bulls, the setup is straightforward: if Citigroup can find its footing at this $116-117 midline, we could see another leg higher toward that upper channel boundary, potentially targeting the $124-128 range again. The structure remains intact, and financial stocks have tailwinds heading into 2025 with interest rate dynamics stabilizing.
But here's what would concern me: A decisive break below that $116 support cluster. If price slices through both the midline and that dashed trendline, the next meaningful support doesn't arrive until the lower channel boundary around $108-112. That's a substantial drop—roughly 8-10% from current levels—and would signal the uptrend structure is losing its integrity.
The risk management here is clean. Bulls can use the $115-116 zone as their line in the sand. A close below that level invalidates the "healthy pullback within an uptrend" thesis and suggests something more concerning is developing beneath the surface.
What we're watching is a banking giant at a technical crossroads. The channel has worked beautifully since April, and there's no reason to abandon that framework until price tells us otherwise. But channels don't last forever, and how Citigroup behaves at this midline support over the next few sessions will likely dictate whether we're looking at another rally attempt or a deeper retracement that tests the patience of recent buyers.
Author

Benjamin Pool
Verified Investing
A seasoned financial expert with a passion for empowering individuals to mastering smart money management.


