Citigroup (C) Stock Price and Forecast: Citi results to start sector boom
- Citigroup is set to report earnings on Friday before the open.
- Recent hawkish Fed moves has led to financial stocks rallying.
- C stock has underperformed banking peers.

Citi (C) shares continued their impressive start to the year with a gain of 1.64% on Tuesday. The stock is lining up for a strong first set of results on Friday, and investors are more favourable toward financial stocks given the hawksh Fed. Citi stock is up 11% so far in 2022, making it one of the top performers.
Citigroup (C) stock news
Earnings will need to be strong to maintain the momentum. It may be a case of "better to travel than arrive" when results hit the tape on Friday. What this market analogy means is the good news is often priced in ahead of the actual news event. Certainly this may be the case with Citi as the stock has rallied over $10 since Christmas. Is this due to anticipation over earnings or simply a new macroeconomic backdrop that will favour financials for most of 2022. We favor the latter.
Earnings are due on Friday before the open. Citigroup is expected to post earnings per share of $1.71 and revenue of $16.98 billion. Citigroup has not missed estimates on the top line (revenue) since Q4 2020, and even then it was a small miss of 1%. Citi's earnings per share (EPS) has not missed estimates since 2015, so based on that track record and the rampant equity market performance in 2021, we should expect another beat.
Citi is exposed to commercial and investment banking, and demand for both is strong. Equity markets, capital raising, IPOs, etc., were all booming in 2021, while house prices, mortgage demand and consumer demand should see a strong performance from the commerical side also. Outlook should be positive with the Fed tightening cycle leading to margin increases from the commerical side.
Citigroup (C) stock forecast
Just for a point of comparison, take a look at the long-term chart below. The Great Financial Crisis decimated the stock and most other financial names.
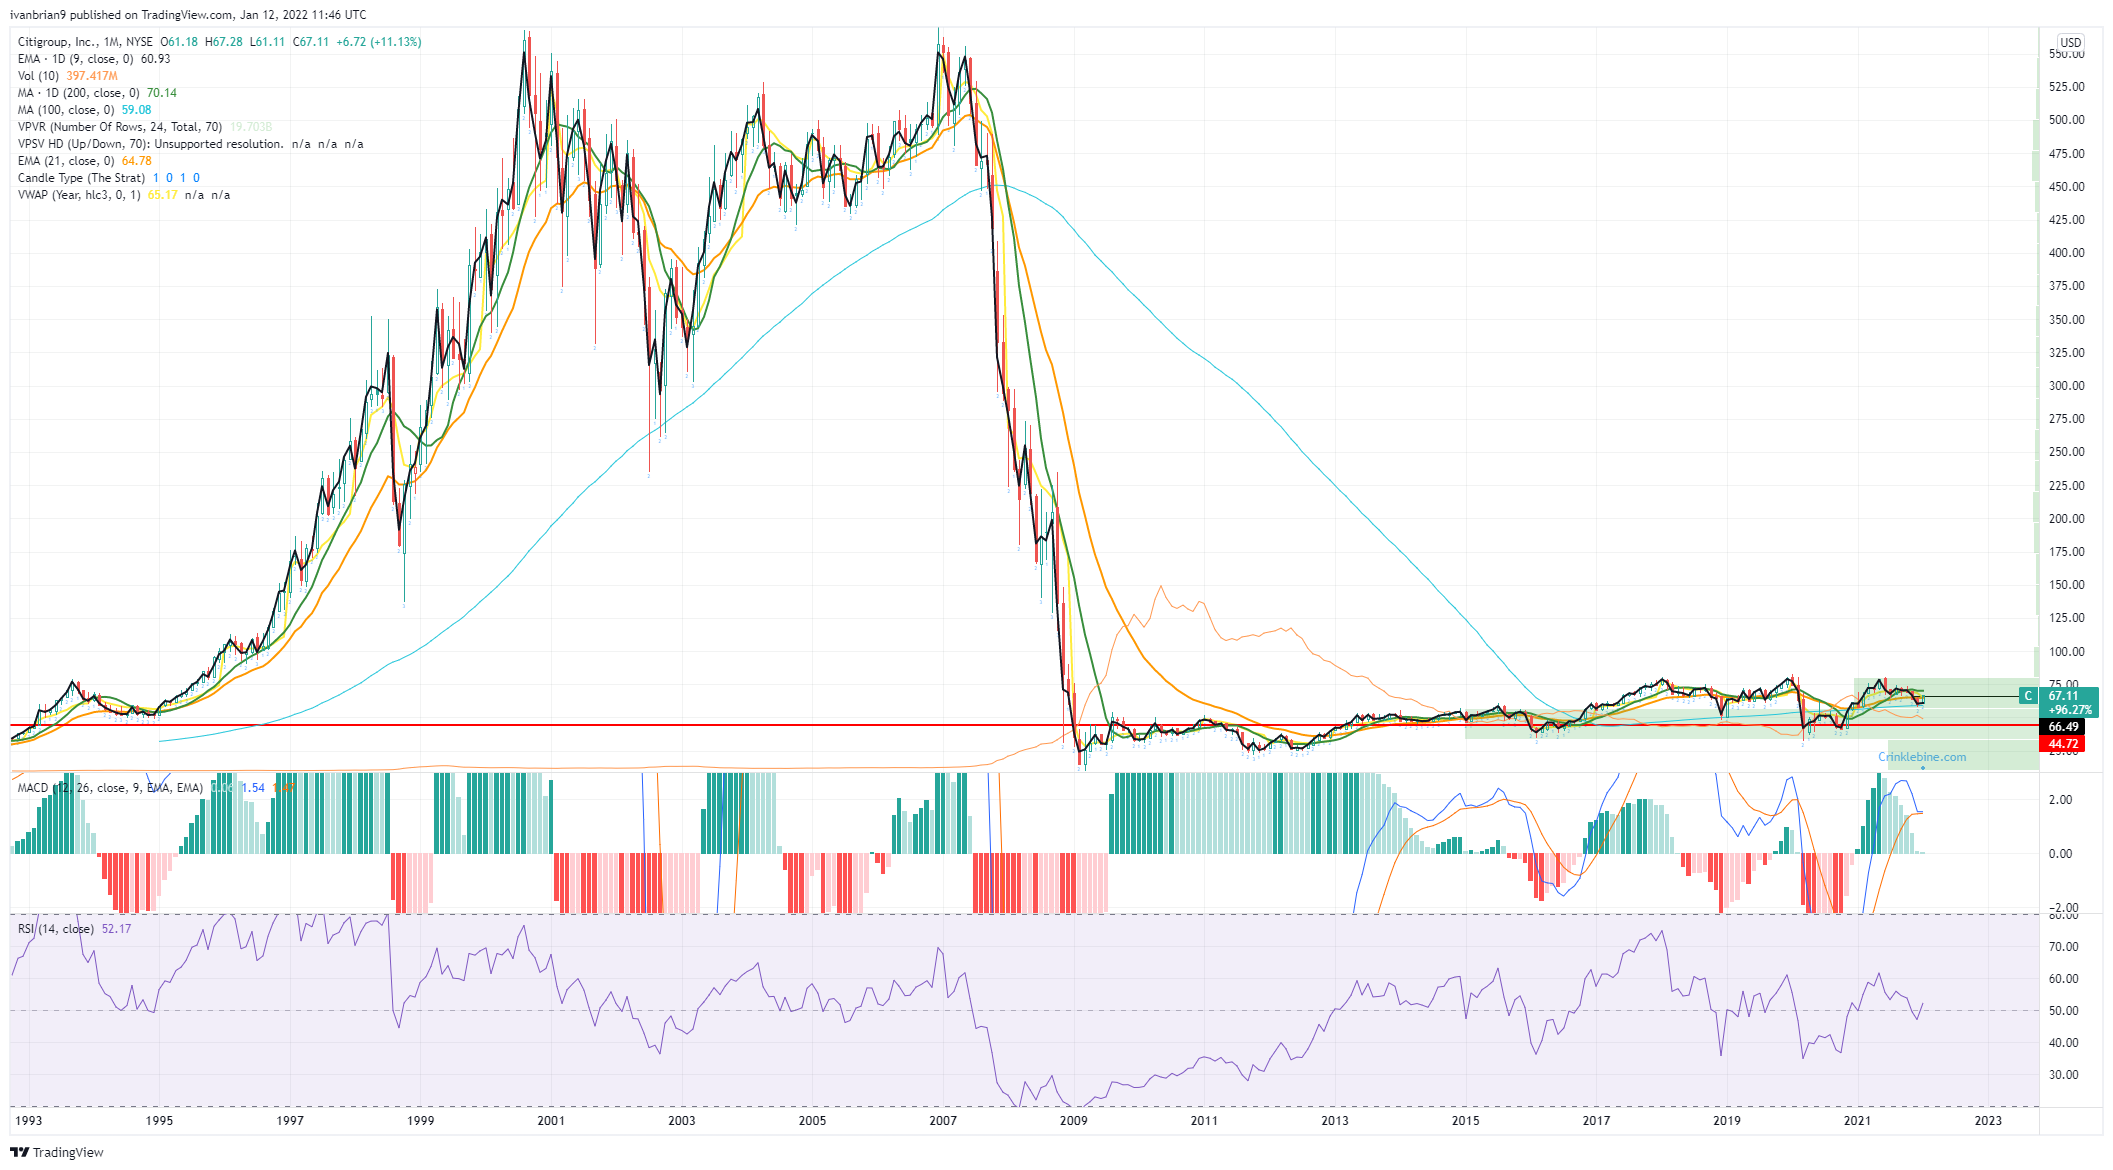
Citigroup (C) chart, monthly
The weekly chart takes this debacle out of focus and shows us the long-term trend. It is clearly bullish with a series of higher lows. Despite the March 2020 pandemic low briefly piercing the previous 2016 low, $80 is a strong resistance.
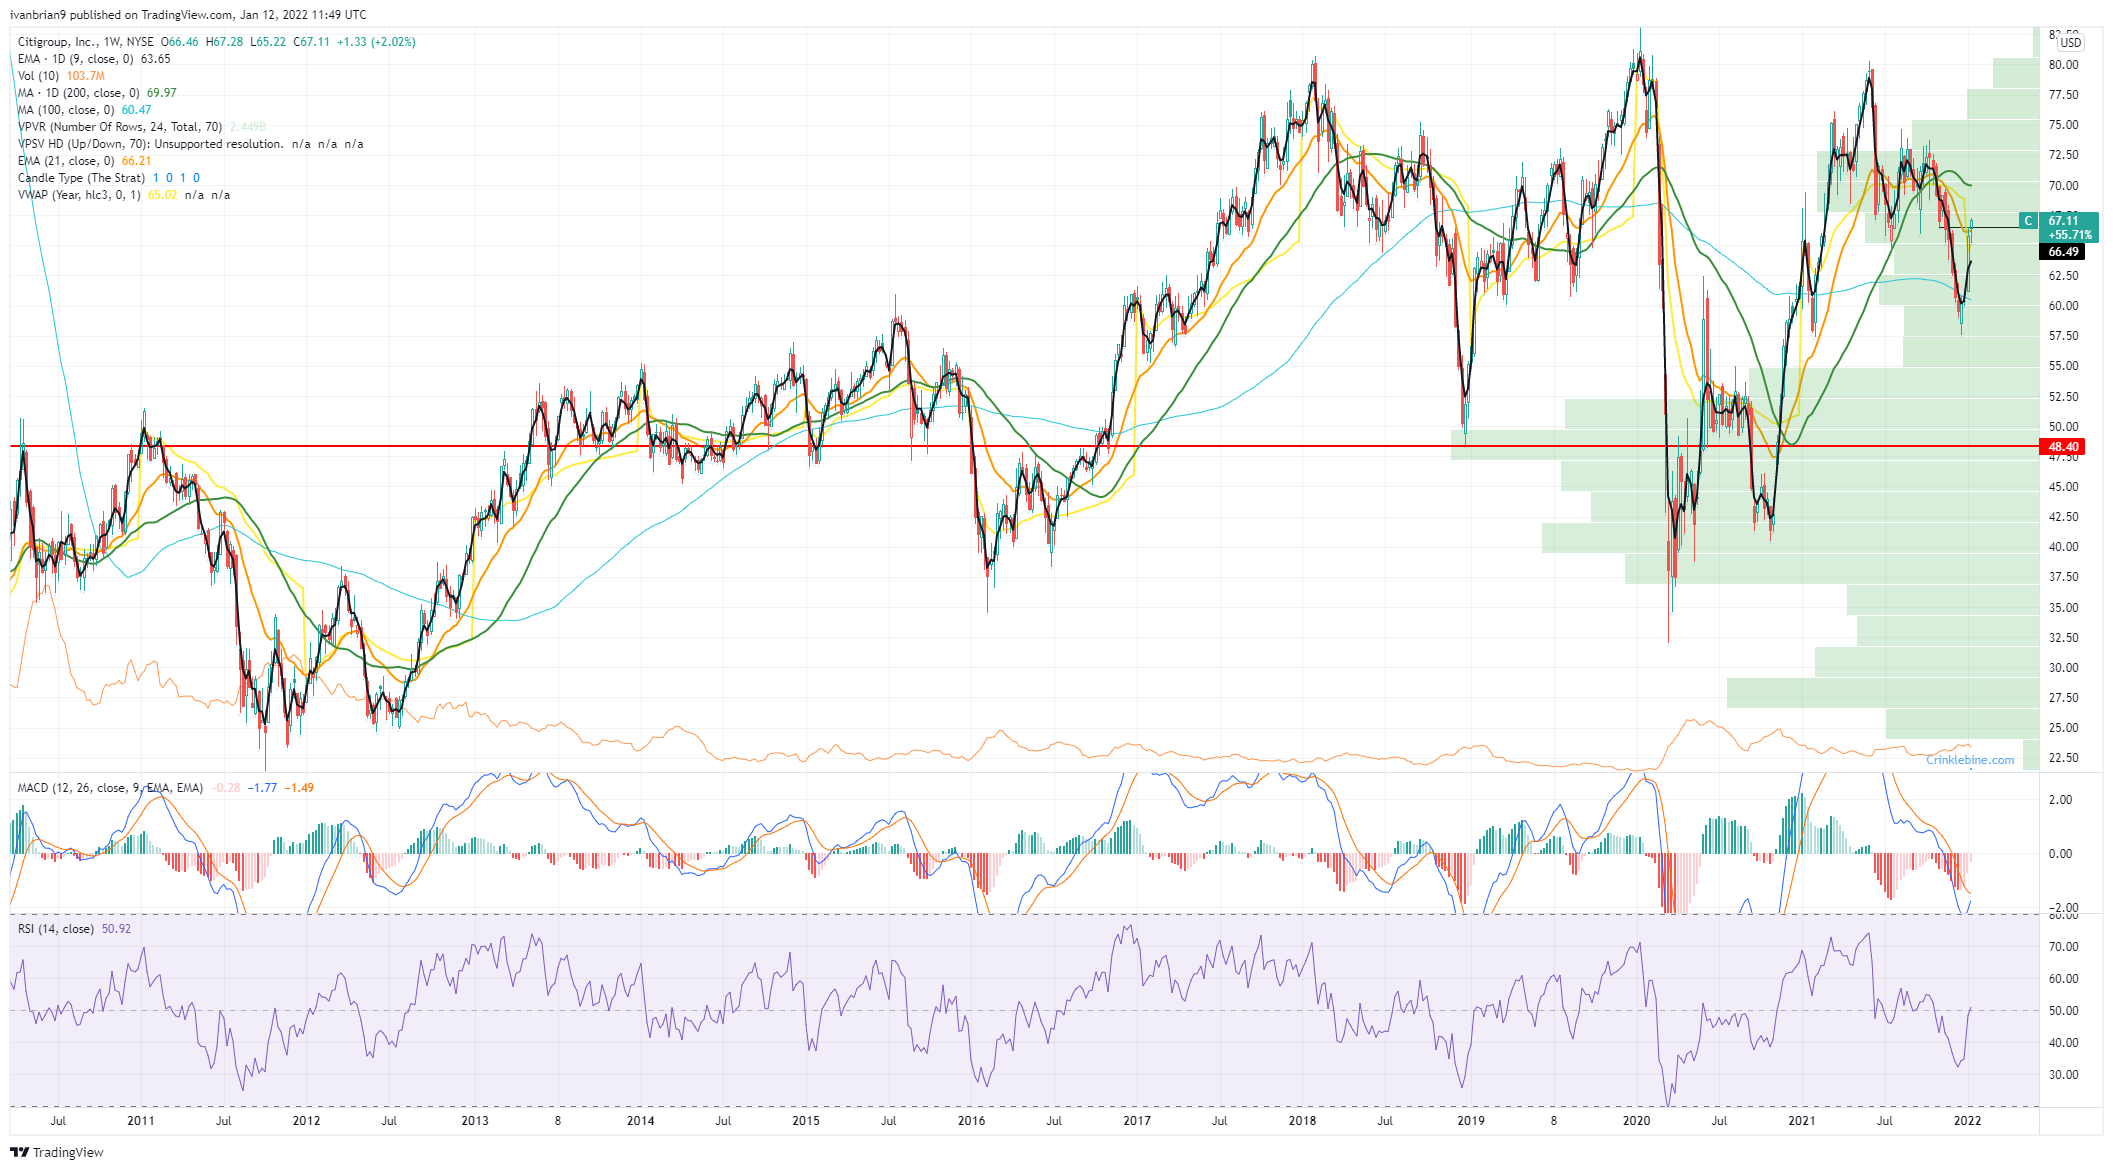
Citigroup (C) chart, weekly
Finally, we move to the daily chart. Citi still is below the 200-day moving average at $70. This is the first target post results. Breaking that still leaves a high volume zone until $73, where the volume profile thins out again. Resistance from $68 to $73 is due to volume, and support at $62.78 is the key pivot in our view.
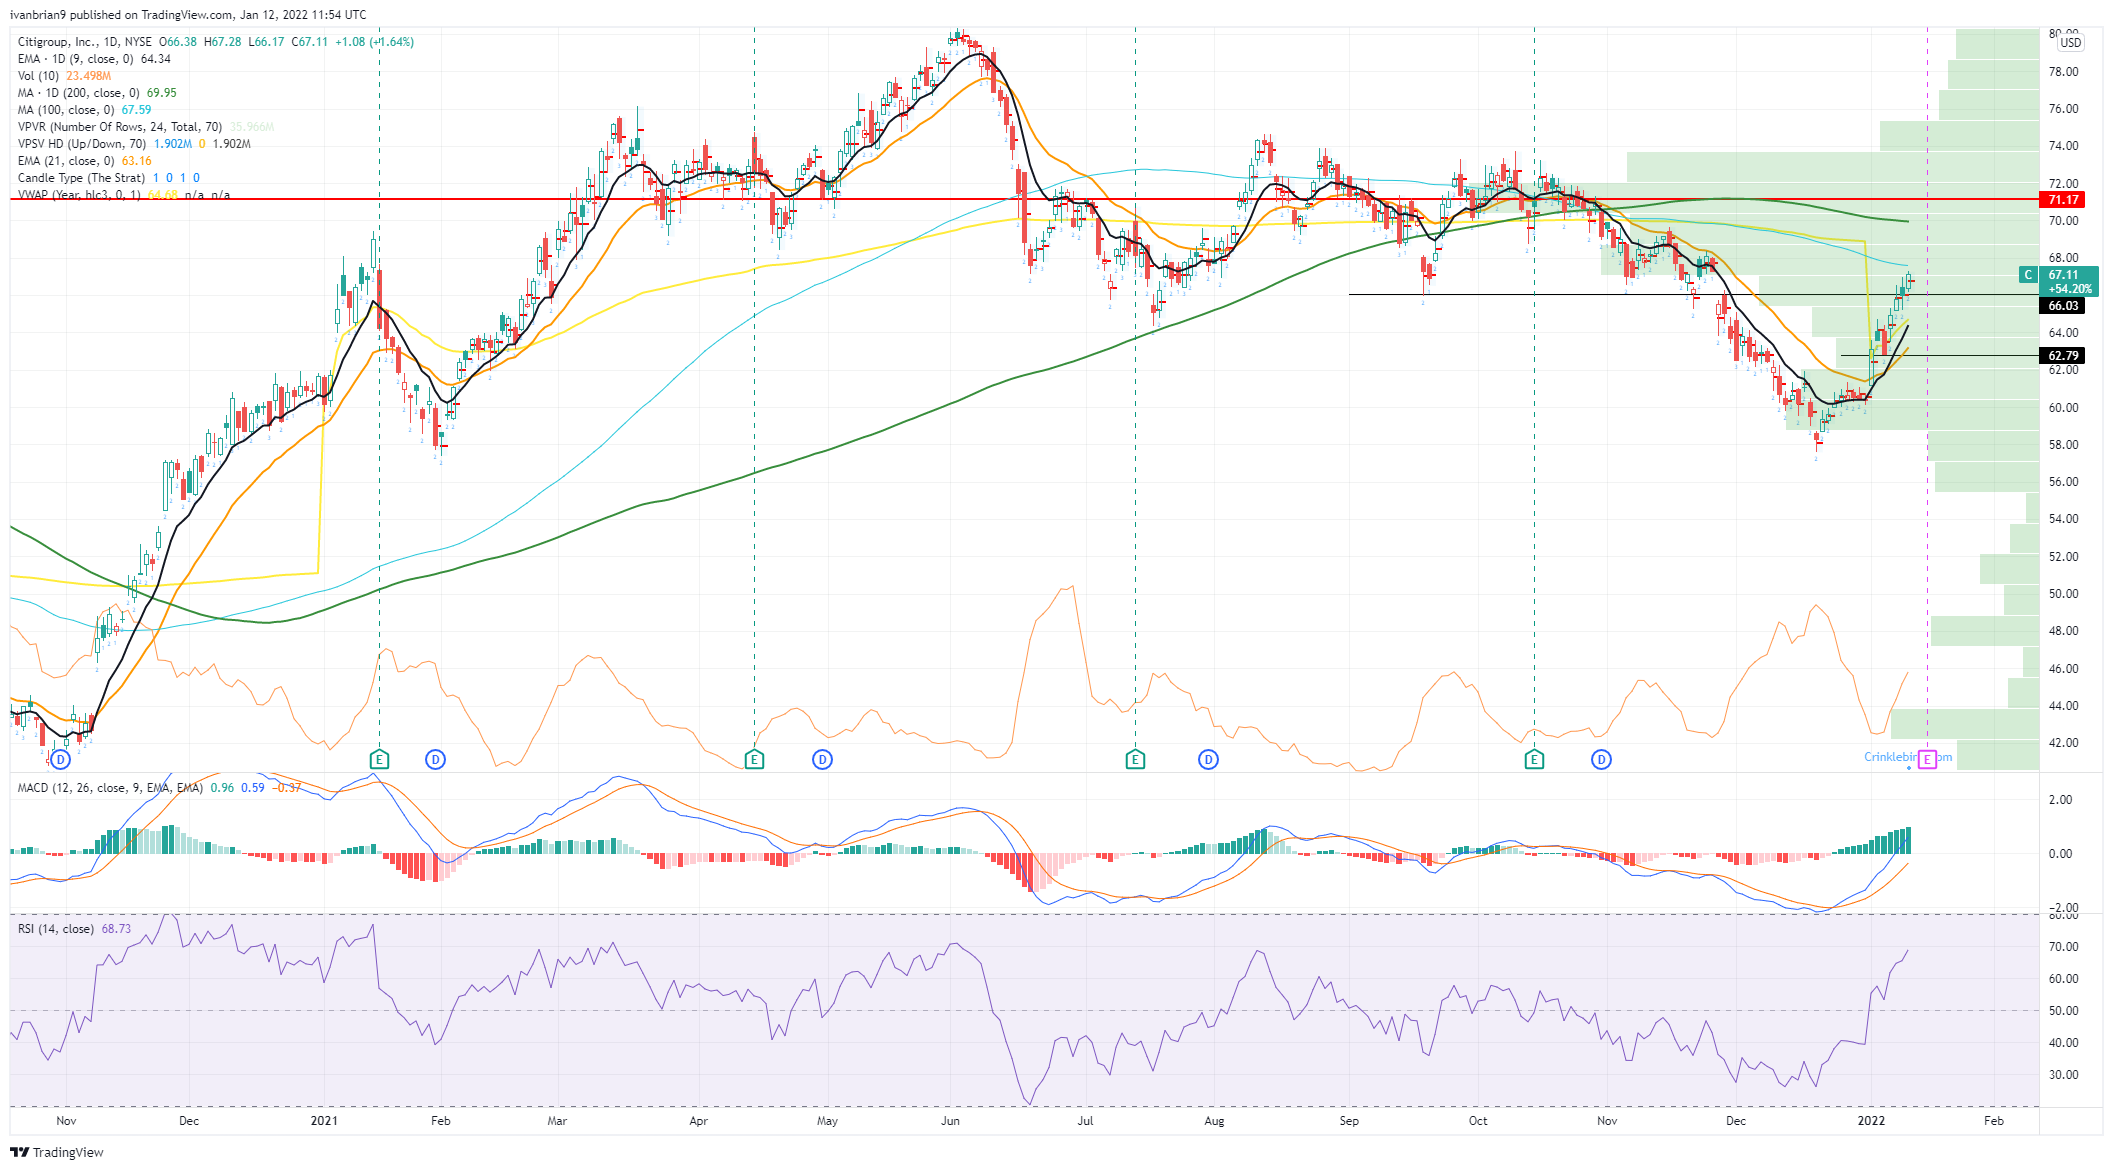
Citigroup (C) chart, daily
Like this article? Help us with some feedback by answering this survey:
Author

Ivan Brian
FXStreet
Ivan Brian started his career with AIB Bank in corporate finance and then worked for seven years at Baxter. He started as a macro analyst before becoming Head of Research and then CFO.


