Walmart Deep Dive Analysis: Hold WMT to play defense vs upcoming US recession

Welcome back to our deep dive series where this time we focus on the consumer sector with Walmart (WMT). As per usual we will look at both fundamental and technical valuation methods to arrive at our 12-month price target for the retail giant. We also take into account the overall market cycle and macroeconomic conditions to run through best and worst-case scenarios and how WMT valuation multiples may change based on the varying scenarios. We combine all this into our price target with robust explanations of each point and outline the potential risks we see to our Walmart price target.
Contents
- Company overview and history
- Wall Street consensus forecasts
- Key valuation rating metrics
- Peer value comparison
- Macroeconomic backdrop, market cycle, and sector analysis
- Recent news and earnings
- Forecast and valuation
- Technical analysis
- Executive summary, recommendation, and price target
Walmart: Company overview and history
Walmart is a retail behemoth that operates a series of retail stories predominantly in North America. The company offers its products at the lowest price point to entice consumers. Walmart operates through three distinct segments: Walmart US, Walmart International and Sams Club.
- The first one is the most visible presence, operating as retail outlets in major population centers throughout the US. Walmart US offers a wide range of consumer products under the Walmart and Walmart Neighbourhood Market brands. Walmart US also includes online e-commerce stores dominated by Walmart.com.
- Walmart International operates in two distinct sections, retail and wholesale, and also operates an e-commerce platform that is dominated by Walmart.ca and Walmart.mx.
- Finally, Sam's Club is a membership-only grocery chain operating in the big box wholesale section and via Samsclub.com.
Walmart is listed on the New York Stock Exchange under the ticker WMT. It was first listed in 1972. Walmart was founded by Sam Walton in 1962.
Also read: Tesla Stock Deep Dive: Price target at $400 on China headwinds, margin compression, lower deliveries
As we can see below, Walmart US is the biggest and most important revenue generator for the overall group. With nearly 70% of total revenues and the highest margins at 5.49%.
Sam's Club has been touted as an increasingly important source of revenue but so far it remains potential rather than current revenue. Since 2018 it has not grown but at least its margins have increased from 1.55% to 3.07%.
As is to be expected with a mature and well-established business, margins and growth rates are consistent and stable. Growth investors would argue there is little catalyst here, but that also means the stock has defensive qualities with stable margins and cash flows making it more attractive in the current environment.
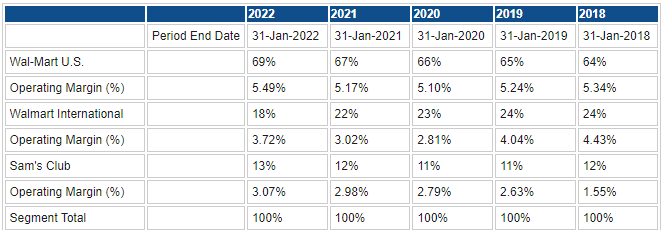
Source: Refinitiv and FXStreet calculations
Those defensive qualities can be seen in the relative performance of WMT stock this year. Despite the well-publicized fall following the latest earnings release in May, Walmart still has outperformed both the S&P 500 and the Nasdaq so far in 2022.
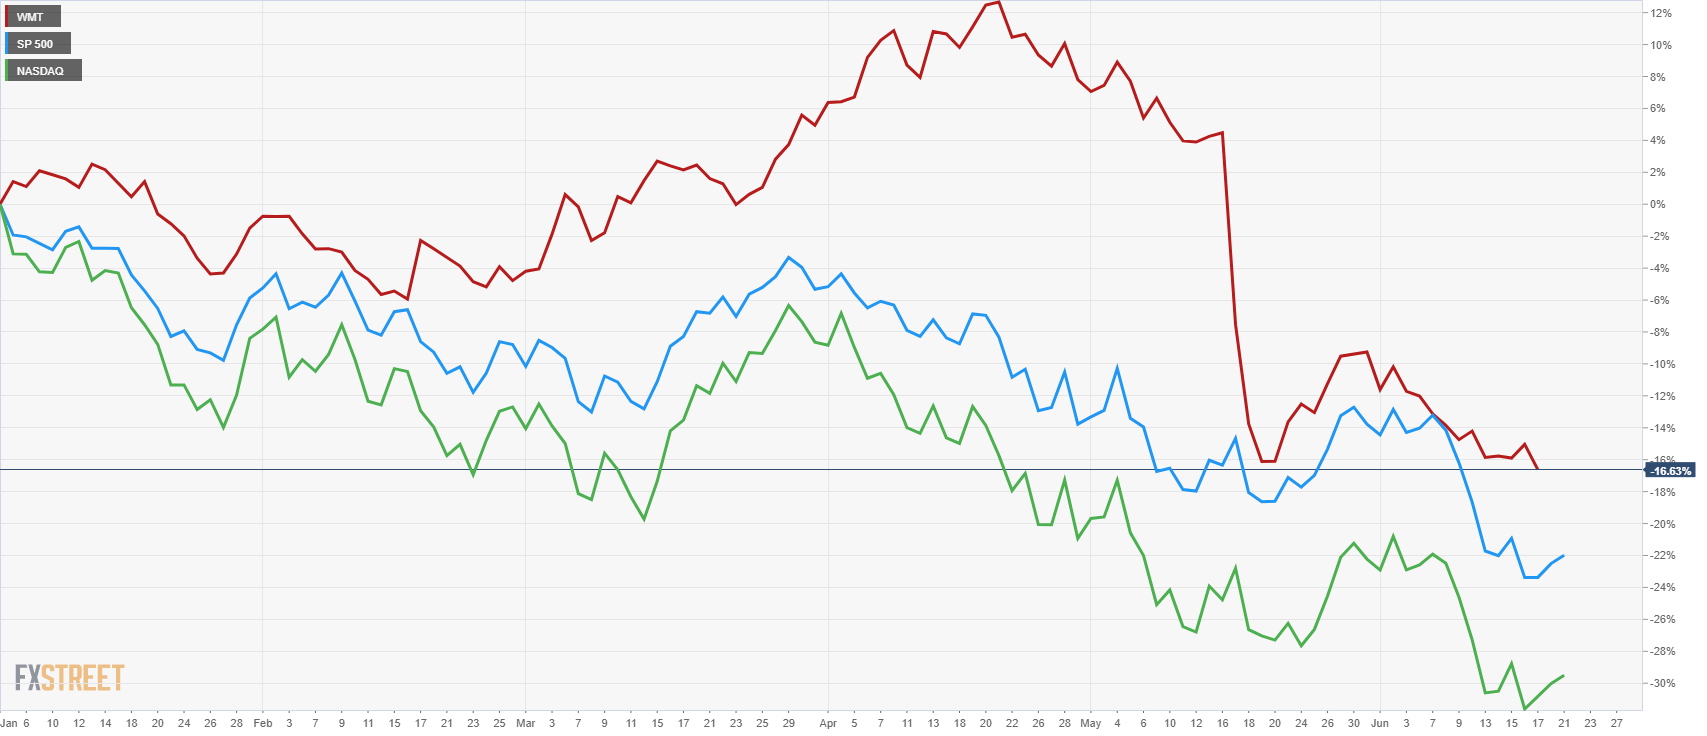
WMT vs S&P500 vs NASDAQ year-to-date performance
When we expand our time horizon to the past five years' performance, we can see how Walmart still keeps track with the S&P 500 but has been totally dwarfed by the returns on offer from the growth heavy Nasdaq.
-637914022104229429.png)
WMT vs S&P500 vs NASDAQ last five years performance
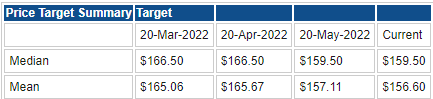
WMT Stock: Wall Street consensus forecasts
Despite the recent downbeat forecasts from Walmart, Wall Street remains optimistic about the retail giant, albeit with a steadily reducing price target. However, the consensus of analysts still see some considerable upside based on the WMT share price of $118.29 (at the time of writing). The average forecast gives some 30%-plus upside. The most recent earnings, and essentially profit warning, has only seen a moderate reduction in forecasts. Next quarter is likely to remain challenging, and those estimates are likely to further reduce.
Key valuation rating metrics
Market cap: $324 billion
Enterprise Value: $487 billion
Free Float: $1.43 billion
IPO date: 25th Aug 1972
52-week high: $160.77
52-week low: $117.27
Short interest: 0.50%
YTD performance: -15%
3-year performance: +7%
Source: Refinitiv, TradingView and FXStreet calculations
Peer value comparison
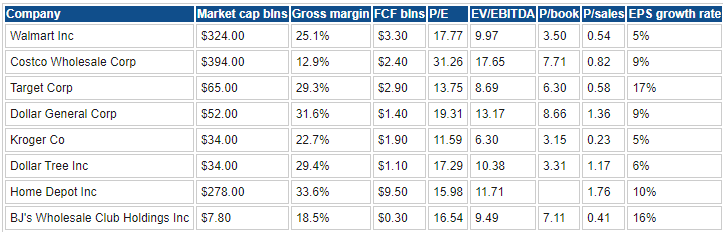
Source: Refinitiv, TradingView and FXStreet calculations
Macroeconomic backdrop, market cycle and sector analysis
We always need to be cognizant of the market cycle we are in and the macroeconomic background when making our investment decision. This we feel is one of the biggest weaknesses of the Wall Street analyst community. The sole focus on the company in question may give analysts laser-like focus, but they fail to appreciate that macroeconomic factors drive earnings that then drive share price performance. Making an investment decision based on purely microeconomic factors is like operating on a patient's leg without checking the pulse first!
Also read: Amazon Stock Deep Dive: AMZN price target at $106 with near-term risks offset by long-term growth
The question now remains not if but when the US will enter a recession and how this will impact stock valuations, in this case Walmart's. The S&P 500 finally bowed to the inevitable last week and entered official bear market territory. It currently stands at -23% for the year. The era of free money and record-low interest rates has come to a sudden end, and equity and bond markets have moved sharply to reprice the new economic scenario.
Bond markets, in particular, have been especially aggressive this year with some significant spikes in yields leading to equity sell-offs. This has largely been down to the lack of clarity from the Federal Reserve, which seems to be continually changing direction and decisions. Last week remains the perfect example when moving from an expected 50 basis point hike for June and July meetings to a knee-jerk reaction and a leaked 75 basis point hike with another one set to follow in July. Financial markets thrive on certainty. This uncertainty is causing investors valuation headaches, and the resulting volatility in asset prices is unsurprising.
Bear markets last on average one year and see an average decline of 40%. Without a recession, that bear market still lasts about a year, but the decline is nearer to 30%. Based on that evidence, we have at least 10% more downside to go and another six months of pain. However, the US is likely to enter a recession, and that likelihood is increasing exponentially.
Deutsche Bank was the first major Wall Street firm to predict a 2023 US recession, but now Nomura has been the first to pencil in a recession for the second half of this year. A recession is defined as two quarters of negative economic growth. US GDP already posted a growth rate of -1.4% in Q1, so all we need to be in a recession is another negative quarter reading for Q2. That data will not be out until July 28, but until then we can observe the Atlanta Federal Reserve's GDP Now tracker which as of June 16 puts Q2 US GDP growth at 0.0%. So, the US may already be in a recession.
All that gives further credence to the fact we have more downside to run in the equity market.
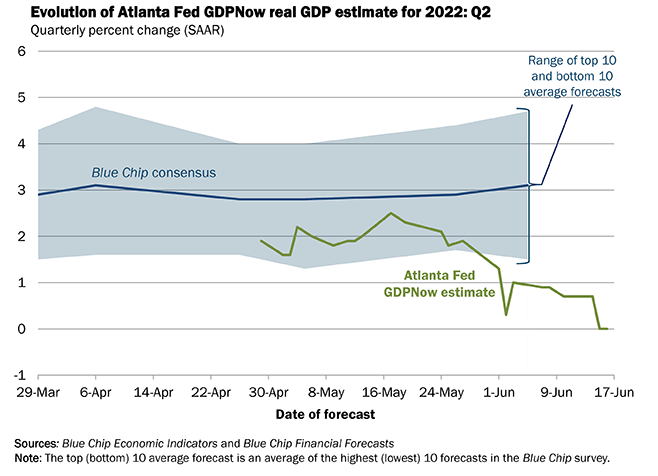
Source: atlantafed.org
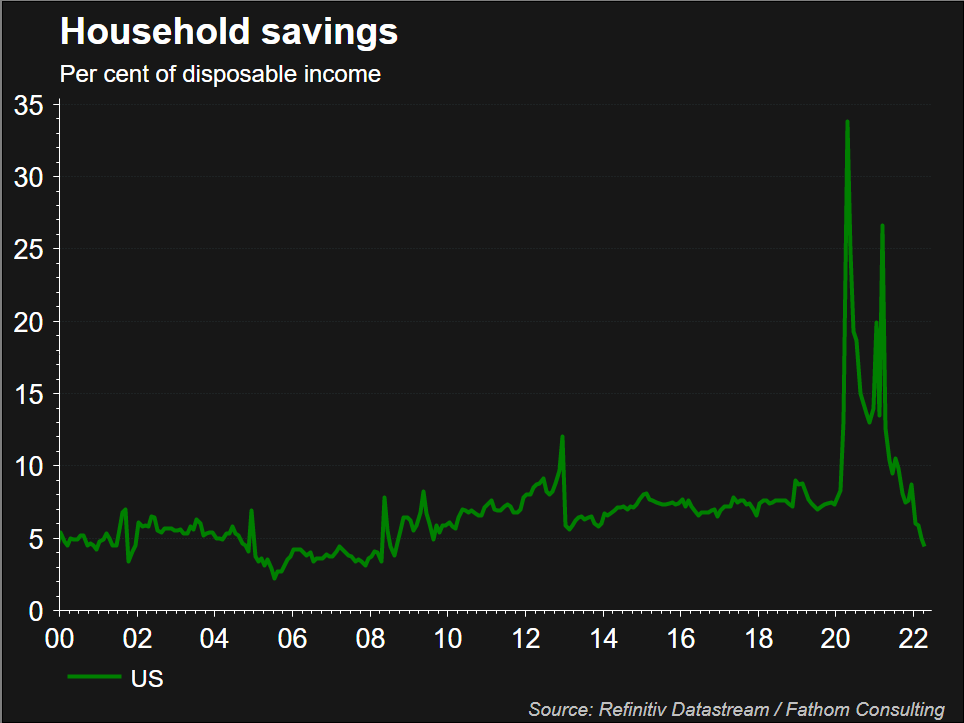
Below, we run through a quick series of charts just to demonstrate the growing likelihood of a US recession. Household savings are being drained to combat rising inflation and prices.
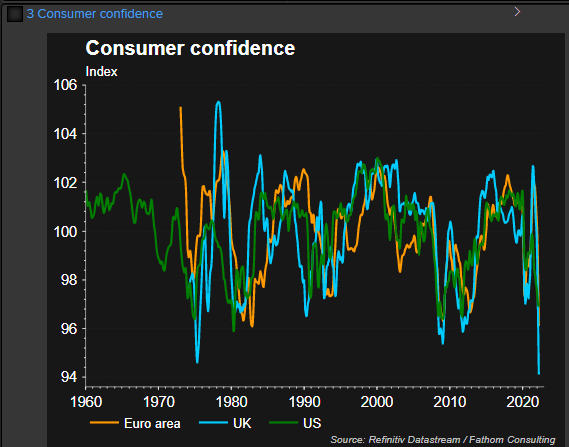
This has meant consumer confidence plummeting to multi-decade lows.
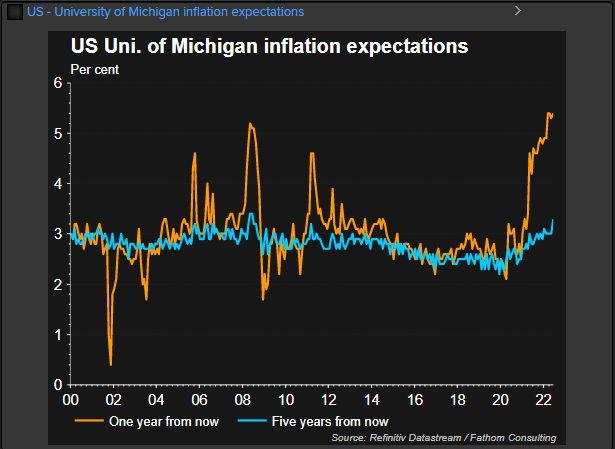
Consumers expect inflation to remain in situ for a year and even the three-year expectation for inflation has crept above 3%, definitely not transitory then! In financial markets perception is reality or rather it leads to reality. If consumers perceive inflation to remain high then they adjust their spending patterns early in order to try and buffet themselves from future effects. This means sentiment falls (as we can see above) and spending is then pulled back.
What all this means for equities on a macro level are lower valuations and lower profits, a bearish combination. Below we show the average price-to-earnings ratio (P/E) for the S&P 500 going back to the 1980s. The average has come back to 20 but in periods of recession, the P/E tends to fluctuate between 10 and 15.
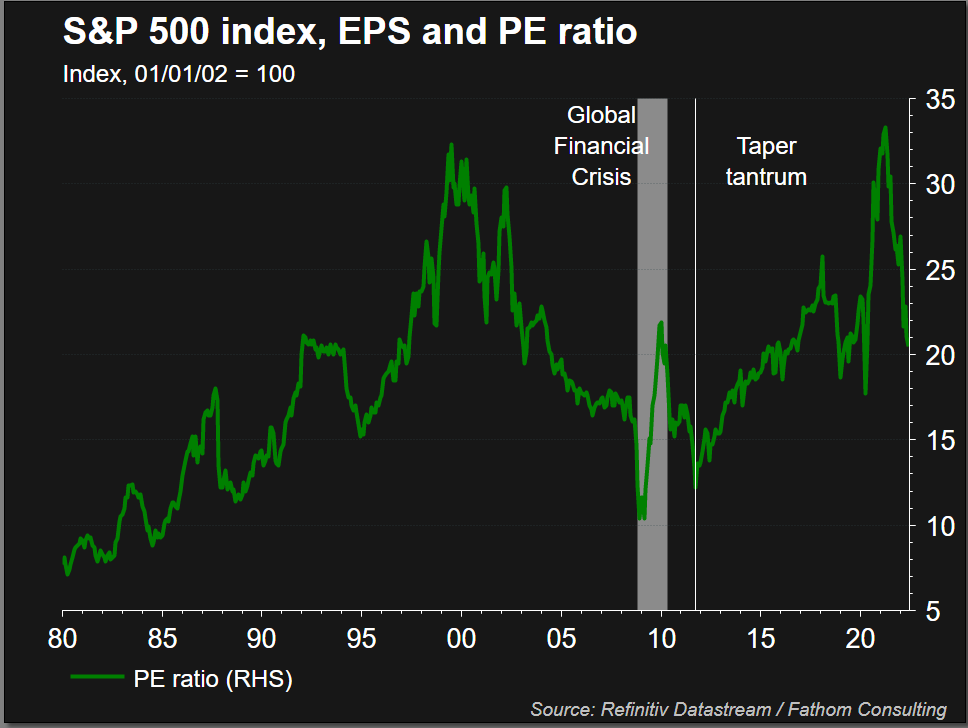
More pain is likely for the broader market which will impact our price target assumptions for Walmart.
Recent Walmart news and earnings
Walmart reported earnings that shocked Wall Street on May 17. It was not so much the earnings themselves but the commentary and forecasts. Revenue beat analysts' forecasts, $141.6 billion versus $138.1 billion in consensus. However, earnings per share (EPS) missed $1.30 versus $1.48 consensus. The big area of concern was shrinking margins, gross margins declined nearly 1%. WMT also lowered full-year and next-quarter guidance.
The combination of a series of poor earnings from other retailers, notably Target (TGT), added to growing pressure on the stock market and confirmed the increased likelihood of a potential US recession. In particular, the commentary around consumers moving away from big-ticket purchases in the face of rising inflation. We feel the recent re-rating of retailers has more room to the downside.
TGT and WMT both essentially admitted on the last earnings call that their inventories were running too high and they had misordered based on pandemic customer tastes. These tastes have now shifted downmarket leaving unsold and unwanted inventory. Target admitted it will have to "right size" its inventory levels which means selling at close to costs levels further hitting margins. Walmart had made similar observations and we feel this margin compression will be painful. This will in our view take two quarters to fully play out after which Walmart will once again be able to build on its low-cost model and so margins should bottom out.
Also read: Nvidia Stock Deep Dive Analysis: NVDA price target at $205 with strong revenue growth
Walmart forecast and valuation
We use numerous methods to arrive at our average WMT price target. We then factor in the macro-environment above as well as the technical outlook on the stock before arriving at our final definitive 12-month price target. The two main models for valuing stocks and companies are discounted cash flow (DCF) and comparative or relative valuation.
DCF takes future cash flows and discounts them to the present value to give us a predicted current market cap. This is then divided by the number of shares to give us our target price. A discounted cash flow model like all valuation methods needs some assumptions. Firstly, we have to forecast expected revenues and margins. We then come up with a discount rate and an expected growth rate. At some point, we have to forecast the terminal value and to do this we use the historical average growth rate. For comparison, we can also use an average EV/EBITDA multiple.
Separately, we calculate scenarios for earnings per share (EPS) and then assign varying P/E ratios based on historical averages for Walmart during previous similar economic cycles.
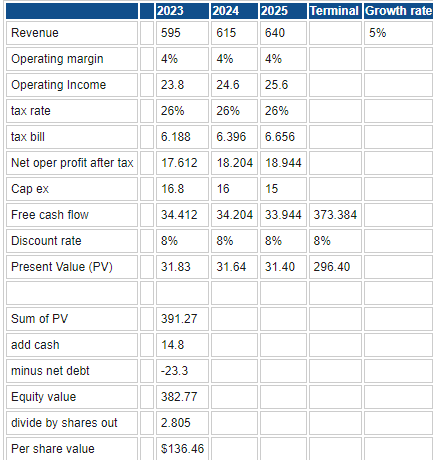
Source: Refinitiv and FXStreet calculations
Our first valuation then is set at $136.46, this is using average analyst forecasts and company forecasts. We only use three years of forecasted data provided by Refinitiv. Many of you schooled in DCF will be more used to 5 to 10-year models but we feel forecasting out 10 years is highly variable.
Next, we reduce our revenue forecasts and predicted margins to account for what we feel is more commonplace in a recession. This gives us a reduced price target of $116.10.
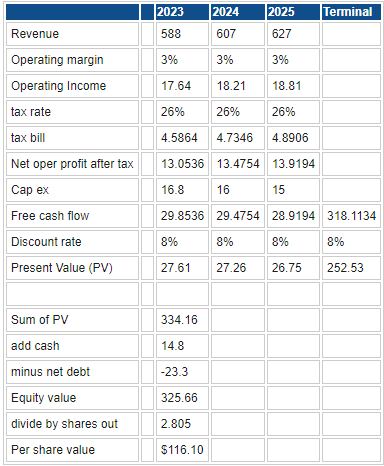
Source: Refinitiv and FXStreet calculations
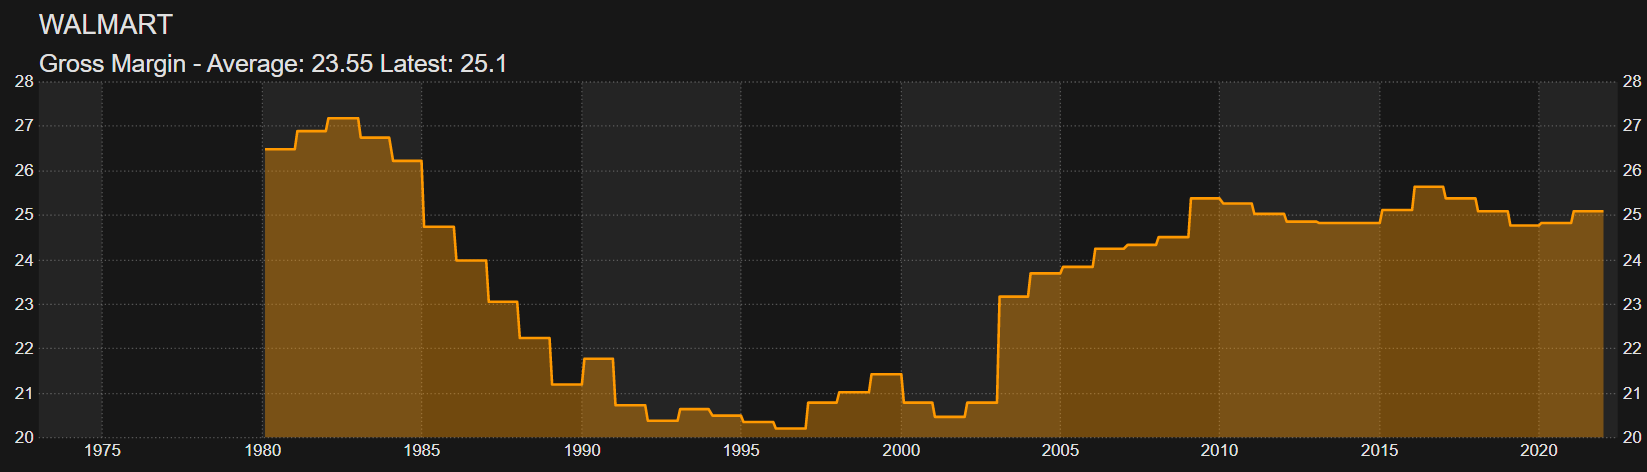
Based on these two methods Walmart is close to fair value. At the time of writing WMT stock is trading at $118. However, Walmart rarely sees its operating margin decline much under 4%, even in a recession, so this is a worst-case scenario unless revenue really diminishes sharply. We feel that is unlikely, as Walmart is a low-cost retailer, which means it should be defensive in nature during a recession. As we can see below going back to the 1980s, Walmart's gross margin has never dipped below 20%. Impressive in such a wide timespan.
Next, we move on to price/earnings (P/E) valuation models and adjust for historical precedent. There is a lot to this table but the important information is at the bottom. Basically, we have adjusted revenue and margins for various scenarios. Then we calculate the EPS based on those assumptions and multiple by 3 different P/E ratios, 15, 20 and 25. We have kept margins around current implied levels which based on the above seems appropriate.
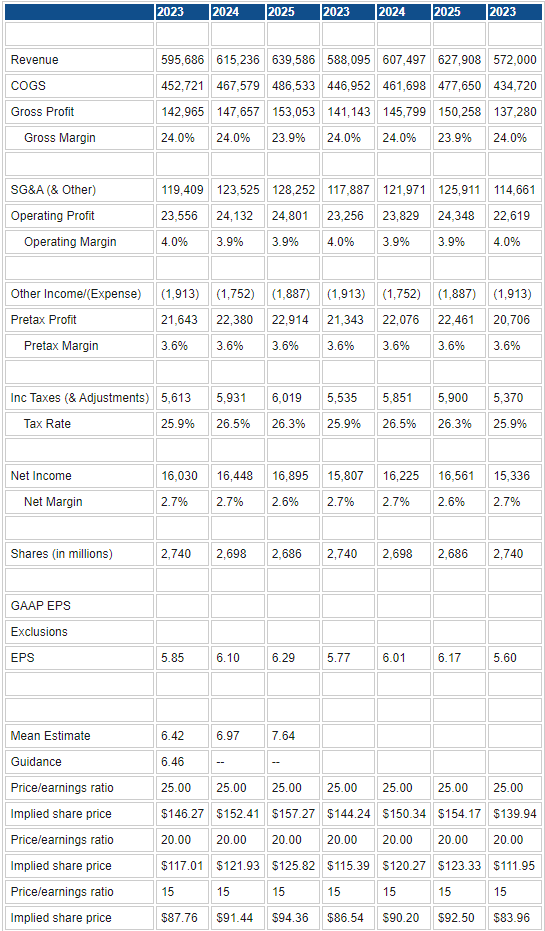
Source: Refinitiv and FXStreet calculations
Our worst-case scenario of lowered revenue for 2023 and using a P/E ratio of 15 gives us a WMT price target of $83.96. As we can see from the below historical chart on trailing P/E, Walmart has seen its P/E dip below 15 but that was during the Global Financial Crisis, and we do not foresee this possible recession as being that severe.
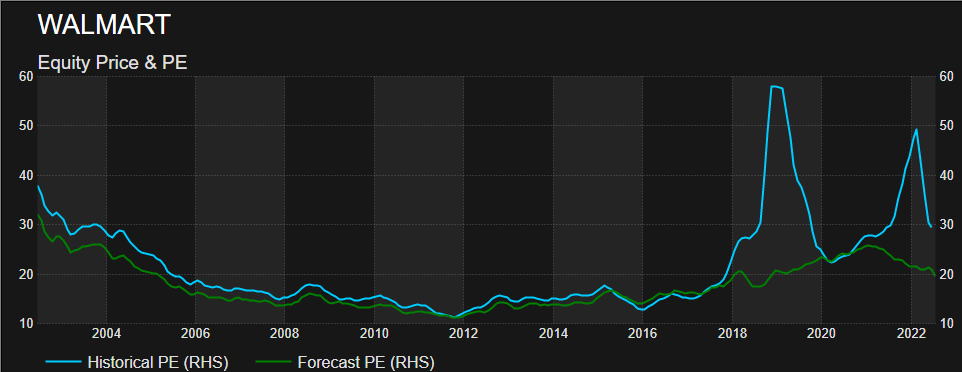
Source: Refinitiv Datastream
In the last ten years, the average forward P/E for Walmart is 18.75. The forward P/E uses the next year's forecasted EPS.
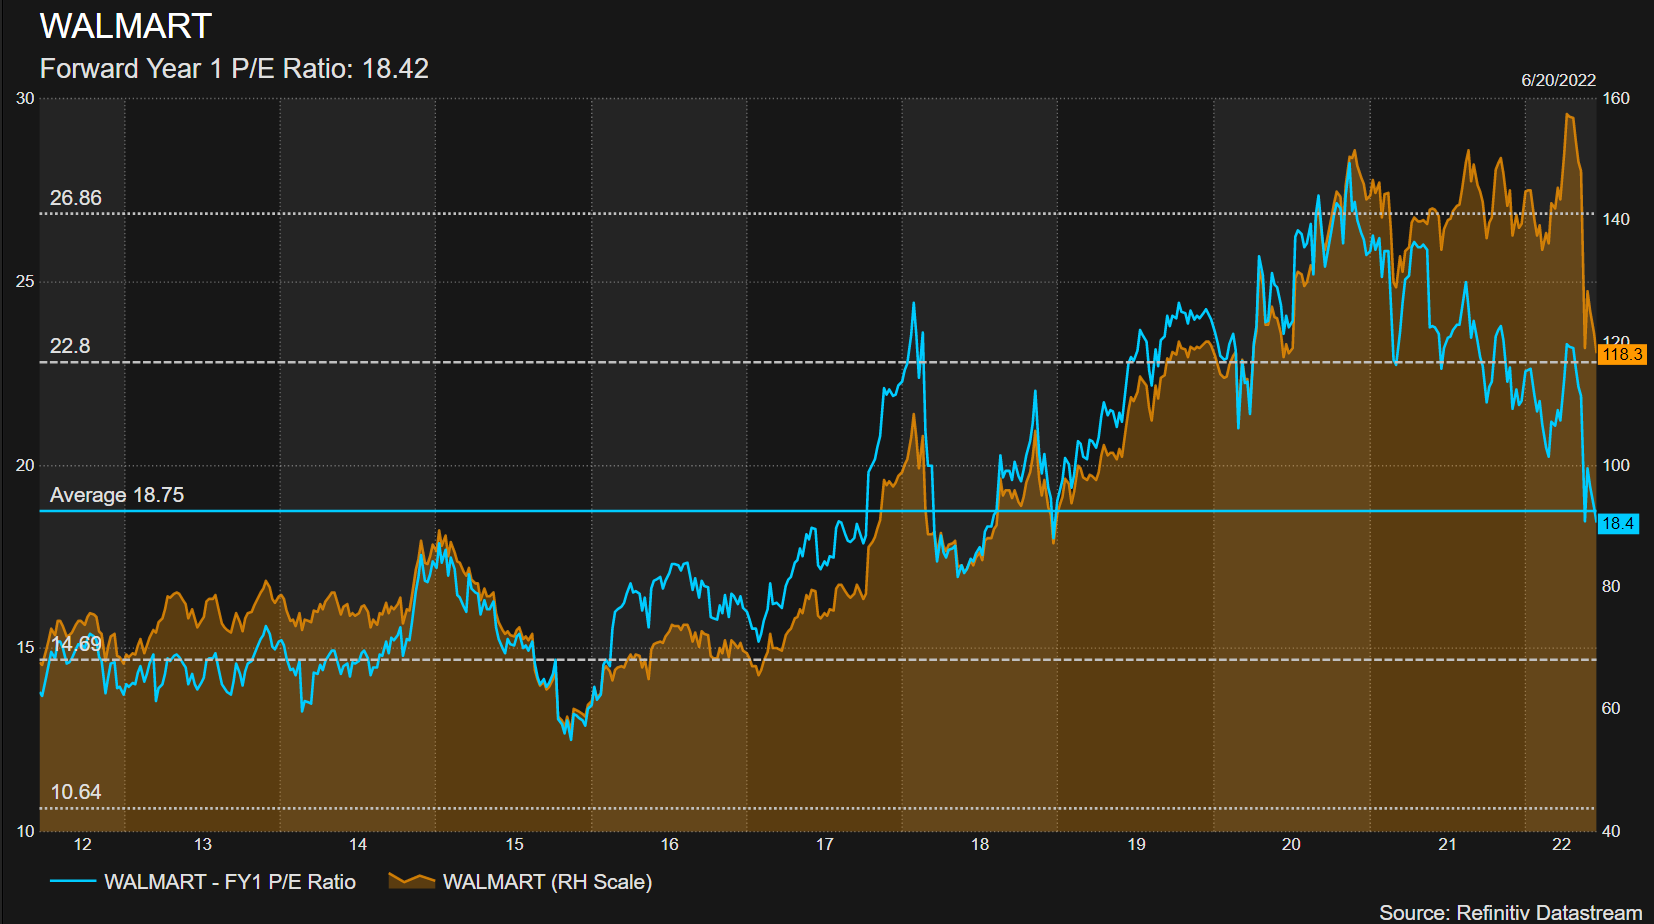
That leaves us with a DCF valuation range of $116 to $136 and a P/E valuation range of $86 to $157. However, the $157 price target is using a P/E of 25 which we think is not applicable in the next 12 months. So our range moves over to the $84-to-$125 range, more in sync with our DCF range. More likely based on the average ten-year P/E of 18.75 the range is more likely to center around our assumptions based on a P/E of 20, giving us a price target range of $111 to $125.
Next, we add in technical analysis to see how this fundamental valuation range fits into the technical outlook.
Walmart: Technical analysis
Walmart stock reacted aggressively to the earnings miss and subsequent Target earnings release. Markets are forward-looking so our main question is how much bad news the WMT price currently reflects. Walmart always adapts quickly to the surrounding environment and customer needs and tastes. We see one more risk quarter in terms of earnings after which the retail giant will have adjusted its inventories to match the environment and demand. This means we do see further weakness for the stock in the short term (3-6 months) as we expect the S&P 500 to continue declining before bottoming out potentially at the end of this year.
The Walmart chart below shows the strong support zone from $100 to $110. This is due to some strong peaks at $110 (high from January 2018) and subsequent pandemic lows around the $102 level. There is also large volume at $100 to $102 which indicates a high level of price acceptance at this point.
After such a strong move, a period of consolidation is commonplace and such a period usually results in a further breakout in the same direction. This would mean more losses for Walmart toward $100. Psychologically round numbers remain magnetic, so a move to test and break $100 is likely in the next few months.
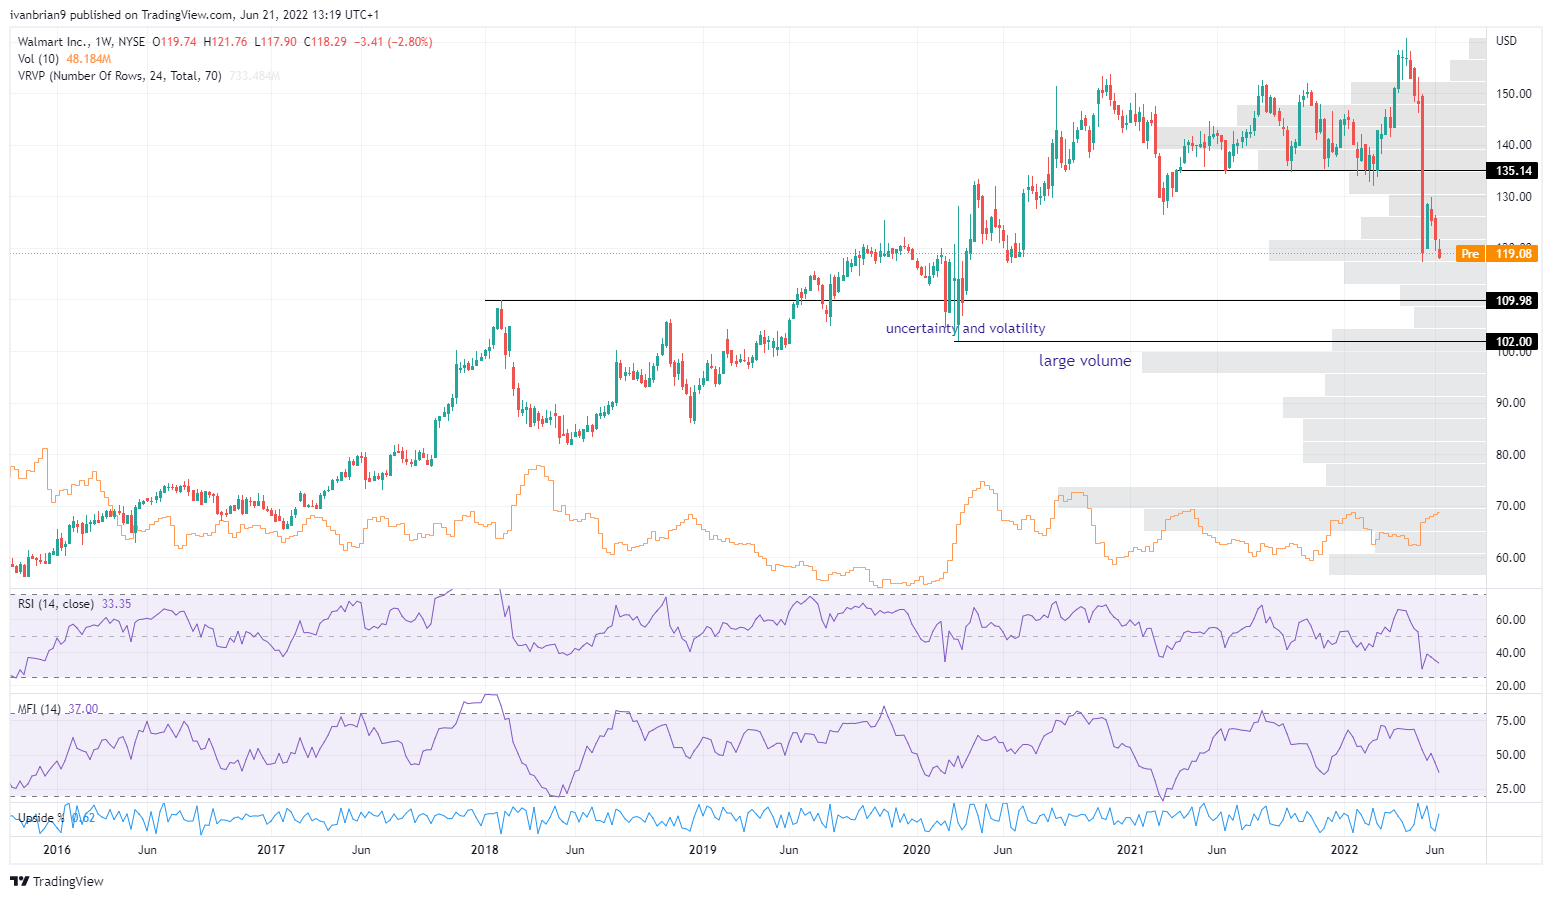
Walmart (WMT) stock, weekly chart
Walmart: Executive summary, recommendation and price target
We feel there is more short-term pain to come for both the equity market and Walmart. But analyst forecasts are for 12-month time horizons and we are much more comfortable with this time scale. Walmart has already handed out some bad news and said it will look to adapt. It may take one or two more quarters but WMT does have a strong track record of adapting.
Fundamentally, the fair value is around or slightly above current levels but with near-term downside risk. However, on a 12-month time horizon, we feel Walmart will maintain historical margins at nearly 24% but this will be offset with price-earnings (P/E) multiples shrinking for both WMT and the broader market.
This gives us a price target of $121. That necessitates a current HOLD rating based on Walmart currently trading at $118.
We will update our models and recommendation post Q2 earnings on August 18.
Upside risks to our valuation
- S&P 500 bottoms out post Q2 earnings.
- Walmart bottoms out post Q2 earnings.
- Walmart adjusts to supply chain issues and inventories in advance of Q2 earnings.
- Inflation coming down more quickly leads to rate hike expectations lowering.
Downside risks to our valuation
- Deep US recession akin to 2008 GFC.
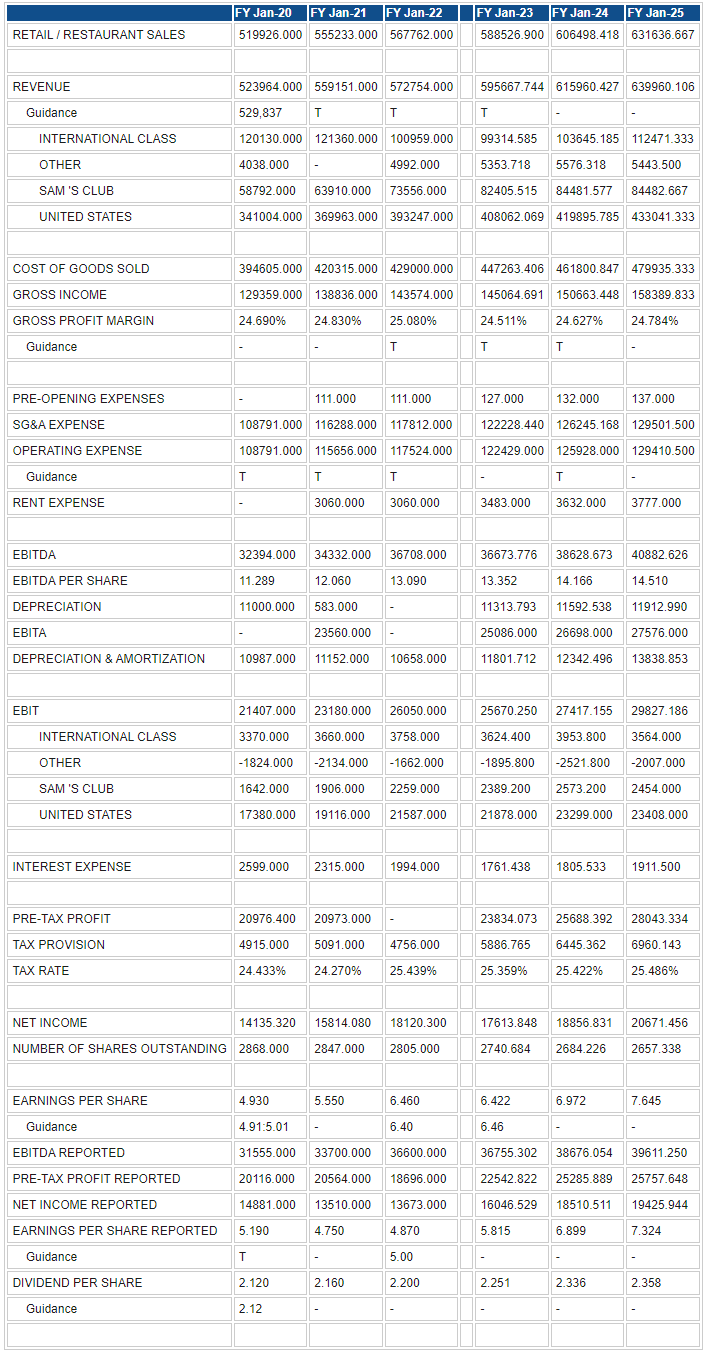
Walmart reported earnings and forecast tables below. These are the foundation for all our DCF models. Data from Refinitiv.
Like this article? Help us with some feedback by answering this survey:
Premium
You have reached your limit of 3 free articles for this month.
Start your subscription and get access to all our original articles.
Author

Ivan Brian
FXStreet
Ivan Brian started his career with AIB Bank in corporate finance and then worked for seven years at Baxter. He started as a macro analyst before becoming Head of Research and then CFO.


