|

Chevron (CVX) looking to do a double correction

Chevron Corporation (CVX) is a global leader in the energy sector. It engages in the exploration, production, and refining of crude oil and natural gas. They operate worldwide, with significant activities in North America, South America, Europe, Africa, the Middle East, and Asia-Pacific. Chevron also manufactures and markets petrochemicals through its affiliate, Chevron Phillips Chemical Company LLC. Below we update the long term technical Elliott Wave outlook for the company.

Chevron monthly Elliott Wave chart

Chart

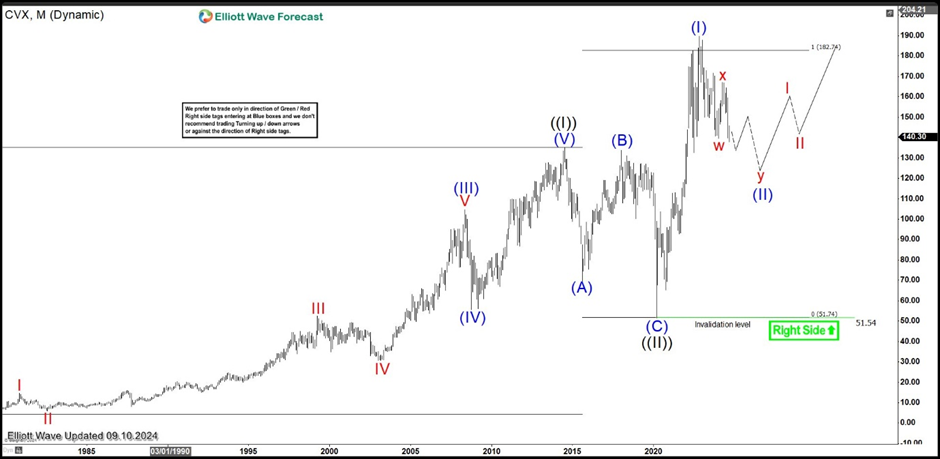
Monthly Elliott Wave Chart of Chevron (CVX) above shows that the stock has ended wave ((II)) Grand Super Cycle degree at 51.5 on March 2020. From there, it has started a new impulsive wave ((III)). Up from wave ((II)), wave (I) ended at 189.68 and wave (II) pullback is currently in progress. Near term, while pullback stays above 51.54, the stock should see further upside.

Chevron daily Elliott Wave chart

Chart

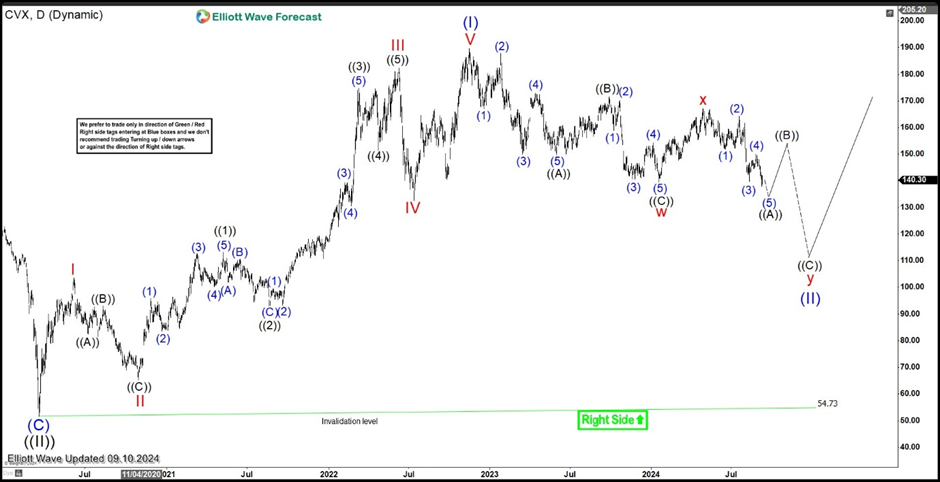
Daily Elliott Wave Chart for Chevron above shows that wave (II) pullback is in progress to correct cycle from March 2020 low. Internal subdivision of the wave (II) pullback is unfolding as a double three Elliott Wave structure. Down from wave (I), wave w ended at 139.62 and wave x rally ended at 167.11. Wave y lower is currently in progress with internal subdivision as a zigzag structure. Potential target lower for the wave (II) is 100% – 161.8% Fibonacci extension of wave w which comes at 84.7 – 116.1 area.

Author

Elliott Wave Forecast Team

Elliott Wave Forecast Team

ElliottWave-Forecast.com

More from Elliott Wave Forecast Team
Share:

Editor's Picks

EUR/USD hovers around nine-day EMA above 1.1800

EUR/USD remains in the positive territory after registering modest gains in the previous session, trading around 1.1820 during the Asian hours on Monday. The 14-day Relative Strength Index momentum indicator at 54 is edging higher, signaling improving momentum. RSI near mid-50s keeps momentum balanced. A sustained push above 60 would firm bullish control.

GBP/USD holds medium-term bullish bias above 1.3600

The GBP/USD pair trades on a softer note around 1.3605 during the early European session on Monday. Growing expectation of the Bank of England’s interest-rate cut weighs on the Pound Sterling against the Greenback. 

Gold sticks to gains above $5,000 as China's buying and Fed rate-cut bets drive demand

Gold surges past the $5,000 psychological mark during the Asian session on Monday in reaction to the weekend data, showing that the People's Bank of China extended its buying spree for a 15th month in January. Moreover, dovish US Federal Reserve expectations and concerns about the central bank's independence drag the US Dollar lower for the second straight day, providing an additional boost to the non-yielding yellow metal. 

Bitcoin, Ethereum and Ripple consolidate after massive sell-off

Bitcoin, Ethereum, and Ripple prices consolidated on Monday after correcting by nearly 9%, 8%, and 10% in the previous week, respectively. BTC is hovering around $70,000, while ETH and XRP are facing rejection at key levels.

Weekly column: Saturn-Neptune and the end of the Dollar’s 15-year bull cycle

Tariffs are not only inflationary for a nation but also risk undermining the trust and credibility that go hand in hand with the responsibility of being the leading nation in the free world and controlling the world’s reserve currency.

Bitcoin, Ethereum and Ripple consolidate after massive sell-off

Bitcoin, Ethereum, and Ripple prices consolidated on Monday after correcting by nearly 9%, 8%, and 10% in the previous week, respectively. BTC is hovering around $70,000, while ETH and XRP are facing rejection at key levels. Traders should be cautious: despite recent stabilization, upside recovery for these top three cryptocurrencies is capped as the broader trend remains bearish.