|

Chevron (CVX) double correction possible while trend remains bullish

Chevron Corporation is a global energy company that specializes in oil and gas. It’s headquartered in San Ramon, California, and operates in more than 180 countries. Below we update the long term Elliott Wave outlook of the company.

Chevron monthly Elliott Wave chart

Chart

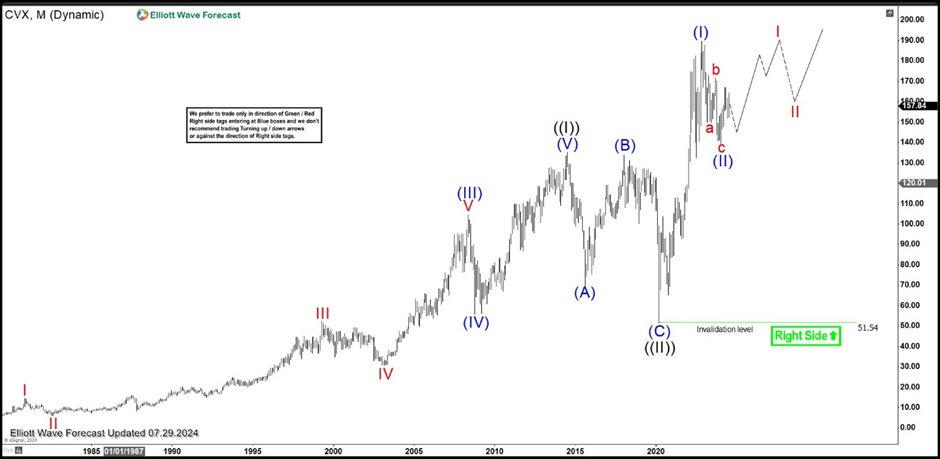
Monthly Elliott Wave Chart of Chevron (CVX) above shows wave ((I)) Grand Super Cycle ended at 135.1. Pullback in wave ((II)) unfolded as a zigzag Elliott Wave structure. Down from wave ((I)), wave (A) ended at 69.58. Wave (B) corrective bounce ended at 133.88. Stock then resumed lower in wave (C) towards  51.54. This completed wave ((II)) in higher degree. The stock has turned higher in wave ((III)) which subdivides into impulsive structure. Up from wave ((II)), wave (I) ended at 189.68. Wave (II) pullback is proposed complete at 139.62 but the stock still needs to break above wave (I) at 189.68 to rule out a double correction. While above 51.54, expect pullback to find support in 3, 7, or 11 swing for further upside.

Chevron daily Elliott Wave chart

Chart

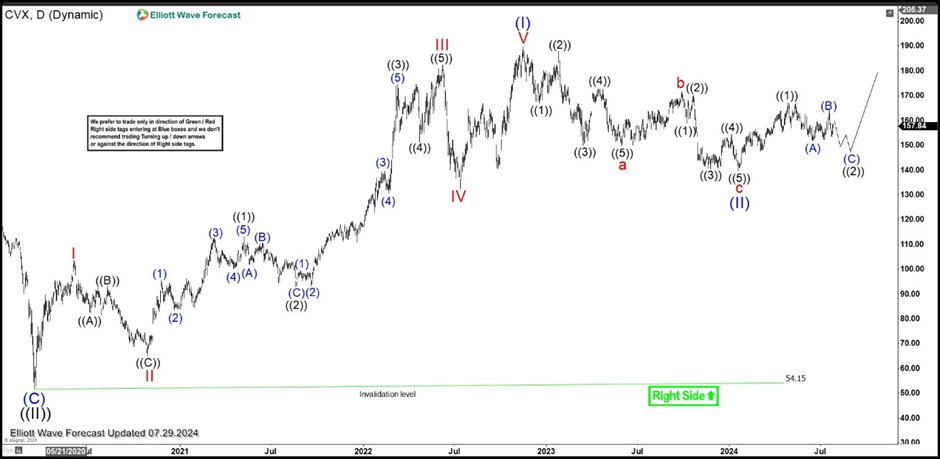
Daily Elliott Wave Chart for Chevron above shows that rally in wave (I) ended at 189.68. Wave (II) is proposed complete at 139.62 with internal subdivision as a zigzag. The stock has turned higher in wave (III) as a 5 waves impulse, although it still needs to break above wave ((1)) at 167.11 to rule out a double correction. Up from wave (II), wave ((1)) ended at 167.11. There’s scope for the stock to do another leg lower before ending wave ((2)). As far as it stays above 54.15, expect dips to find support in 3, 7, or 11 swing for further upside.

Author

Elliott Wave Forecast Team

Elliott Wave Forecast Team

ElliottWave-Forecast.com

More from Elliott Wave Forecast Team
Share:

Markets move fast. We move first.

Orange Juice Newsletter brings you expert driven insights - not headlines. Every day on your inbox.

By subscribing you agree to our Terms and conditions.

Editor's Picks

EUR/USD holds steady near 1.1750 on first trading day of 2026

EUR/USD stays calm on Friday and trades in a narrow channel at around 1.1750 as trading conditions remain thin following the New Year holiday and ahead of the weekend. The economic calendar will not feature any high-impact data releases.

GBP/USD struggles to gain traction, stabilizes above 1.3450

After testing 1.3400 on the last day of 2025, GBP/USD managed to stage a rebound. Nevertheless, the pair finds it difficult to gather momentum and moves sideways above 1.3450 as market participants remain in holiday mood.

Gold climbs toward $4,400 following deep correction

Gold reverses its direction and advances toward $4,400 after suffering heavy losses amid profit-taking before the New Year holiday. Growing expectations for a dovish Fed policy and persistent geopolitical risks seem to be helping XAU/USD stretch higher.

Cardano gains early New Year momentum, bulls target falling wedge breakout

Cardano kicks off the New Year on a positive note and is extending gains, trading above $0.36 at the time of writing on Friday. Improving on-chain and derivatives data point to growing bullish interest, while the technical outlook keeps an upside breakout in focus.

Economic outlook 2026-2027 in advanced countries: Solidity test

After a year marked by global economic resilience and ending on a note of optimism, 2026 looks promising and could be a year of solid economic performance. In our baseline scenario, we expect most of the supportive factors at work in 2025 to continue to play a role in 2026.

Crypto market outlook for 2026

Year 2025 was volatile, as crypto often is.  Among positive catalysts were favourable regulatory changes in the U.S., rise of Digital Asset Treasuries (DAT), adoption of AI and tokenization of Real-World-Assets (RWA).