|

Chart analysis: Nvidia (NVDA) breaks key trendline

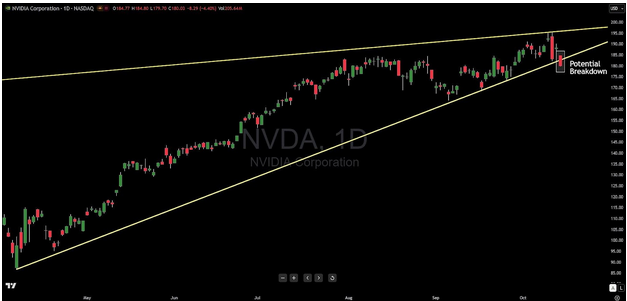
Shares of Nvidia (NVDA) broke a major support trendline that stretches back to April 7th, 2025. Up until the break, price has always bounced off of it, showing its staying power. However, that has changed.

Please note, a close below a trendlines is an unconfirmed breakdown. This alerts technical investors and traders that Nvidia is on thin ice. Should it confirm, the fall is likely to $150/share. However, until it confirms, it still has a chance to regain the support trendline at $184.00.

Today, the stock is trading higher off of ASML earnings. Interestingly enough, NVDA is trading at $184, back to that same trendline. However, the day is just getting started. As a technical trader I will be watching to see if it closes back above $184 (safe), below $184 (still a caution sign) or confirms with a close below $180 (confirmed breakdown).

Chart

Author

Gareth Soloway

Gareth Soloway

Verified Investing

A renowned trader and financial expert specializing in chart analysis and market insights.

More from Gareth Soloway
Share:

Editor's Picks

EUR/USD advances as US-Iran peace deal weighs on US Dollar

EUR/USD rises after registering minor losses in the previous day, trading around 1.1610 during the Asian hours on Monday. The pair appreciates as the US Dollar declines amid easing risk aversion following the reports that the United States and Iran agree on a peace deal to end the war and reopen the Strait of Hormuz.


GBP/USD hovers around 1.3400 as investors await war clarity

GBP/USD remains near its daily open, not far from 1.3400, in the second half of Friday's session. The US Dollar lost its previous intraday strength and weakens as investors await clarity on the US-Iran war.

Gold rises to weekly high as US, Iran reach peace deal

Gold price rises to a weekly high during the Asian trading hours on Monday. The precious metal rebounds after the United States and Iran had reached a deal to end their conflict, easing concerns about inflation and higher interest rates.


Experts agree: Bitcoin nears bottom, but weak demand raises doubts

Bitcoin is trading above $63,000 at the time of writing on Friday after rebounding from the key 200-week Simple Moving Average near $62,000, a level widely viewed as key long-term support. The recovery may suggest that Bitcoin has found a floor after a sharp correction that spanned more than a month, but some warning signs persist.

BoJ set to hike, but will it save the Yen?
The Bank of Japan is poised to hike interest rates for the fifth time in this tightening cycle on Tuesday, taking the policy rate from 0.75% to 1.00%. As has become customary for BoJ rate hikes lately, the hawkish rhetoric has been intensifying in the run up to the meeting, with Governor Ueda essentially locking in the move in his last appearance on June 3.
4.2% headline, 0.2% core: Why the Fed's next hike may be targeting the wrong problem

May's CPI put headline inflation at 4.2% on the year, up from 3.8% in April and the hottest reading since April 2023, while core prices rose just 0.2% on the month, undershooting the 0.3% consensus and halving April's pace.