Experts agree: Bitcoin nears bottom, but weak demand raises doubts
- Bitcoin rebounds slightly, trading above $63,000 on Friday, after finding support around the 200-week SMA at $62,000.
- US-listed spot ETFs recorded outflows of over $400 million through Thursday, pointing to the fifth consecutive week of withdrawals.
- Analysts highlight that BTC’s price bottom may be near, but a regime change to a bull market is still far.

Bitcoin (BTC) is trading above $63,000 at the time of writing on Friday after rebounding from the key 200-week Simple Moving Average (SMA) near $62,000, a level widely viewed as key long-term support.
The recovery may suggest that Bitcoin has found a floor after a sharp correction that spanned more than a month, but some warning signs persist. First, the institutional sell-off continues, with spot BTC Exchange-Traded Funds (ETFs) pointing to the fifth consecutive week of outflows. Second, analysts suggest that a sustained bullish reversal is unlikely until demand conditions improve significantly, something that has yet to happen.
Institutional sell-off continues
Institutional demand continued to weaken so far this week. SoSoValue data shows that spot BTC ETFs recorded an outflow of $401.69 million up to Thursday. Unless Friday’s inflows are very significant, BTC is about to mark the fifth week of steady withdrawals, signaling that institutional demand continues to weaken.
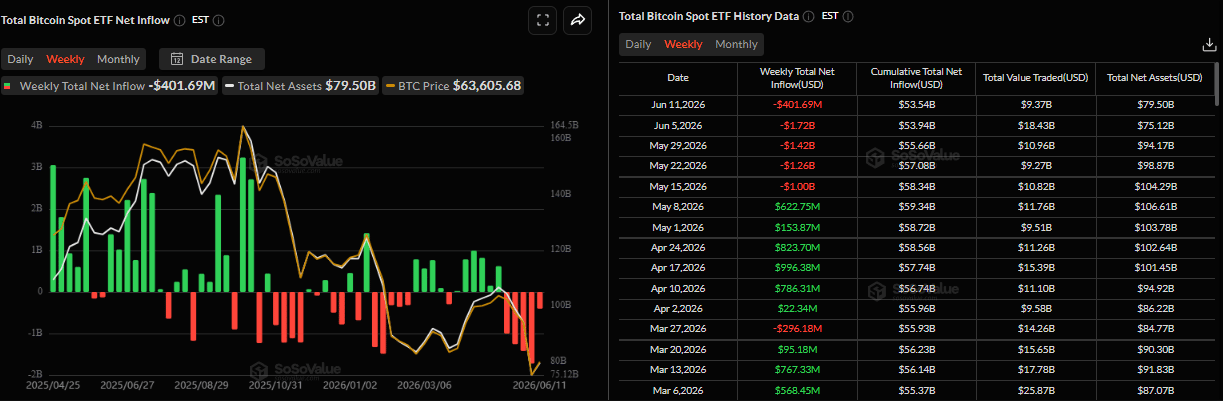
On the corporate side, Strategy reaffirmed its bet on Bitcoin this week. After Michael Saylor’s cryptic “32?” post on his X account on Sunday, hinting at the recent sale of 32 BTC last week, Strategy announced the acquisition of 1,550 BTC on Monday, bringing total holdings to 845,256 BTC, indicating the firm’s long-term stance despite the recent wave of fear surrounding last week’s 32 BTC sell-off.
Uncertainty surrounds the US-Iran peace deal
US President Donald Trump said on Thursday that he believed Iran’s Supreme Leader Mojtaba Khamenei had approved a deal with the US. The deal would trigger the reopening of the Strait of Hormuz and the lifting of a US blockade on Iranian ports.
Reuters reported that, when asked by a reporter at the White House whether Khamenei had approved the deal, Trump said: “I understand the answer is yes.”
The optimism, however, faded rather quickly as Iran countered that it had not reached a final decision on an agreement. Furthermore, reports suggest that Iran’s Khamenei has not agreed to the proposed US peace deal. Iran’s Foreign Ministry reportedly said that key issues, including access to the Strait of Hormuz and frozen funds, remain unresolved, according to Fars news agency.
Meanwhile, Iranian forces blocked a tanker from transiting through the strategic waterway without coordination, underscoring uncertainty over Iran’s position. Adding to this, Fox News reported that US forces intercepted and shot down two Iranian one-way attack drones near the Strait of Hormuz.
These developments have kept uncertainty high, weighing on risk-sensitive assets such as Bitcoin, which has remained under pressure.
Macroeconomic headwinds could limit BTC’s recovery
The US Consumer Price Index (CPI) and Producer Price Index (PPI) released this week pointed to re-accelerating inflation, reaffirming bets that the US Federal Reserve (Fed) will raise borrowing costs by the year-end. Higher expectations of a hawkish Fed strengthen the US Dollar, weighing on risk assets such as BTC.
Moreover, any further escalation of US-Iran tensions risks disrupting Oil supplies through the Strait of Hormuz, which could push Crude Oil prices higher. Higher energy prices could fuel inflationary pressures further and reinforce expectations for a restrictive Fed policy stance.
Where is the bottom for BTC?
CryptoQuant’s weekly report highlights that Bitcoin declined to a fresh bear market low of $59,130 and is now only 9% above its realized price of $53,600, a valuation level historically associated with bear market bottoms across prior cycles. This suggests that, from a pure valuation standpoint, Bitcoin may be approaching a structural floor, as shown in the chart below.
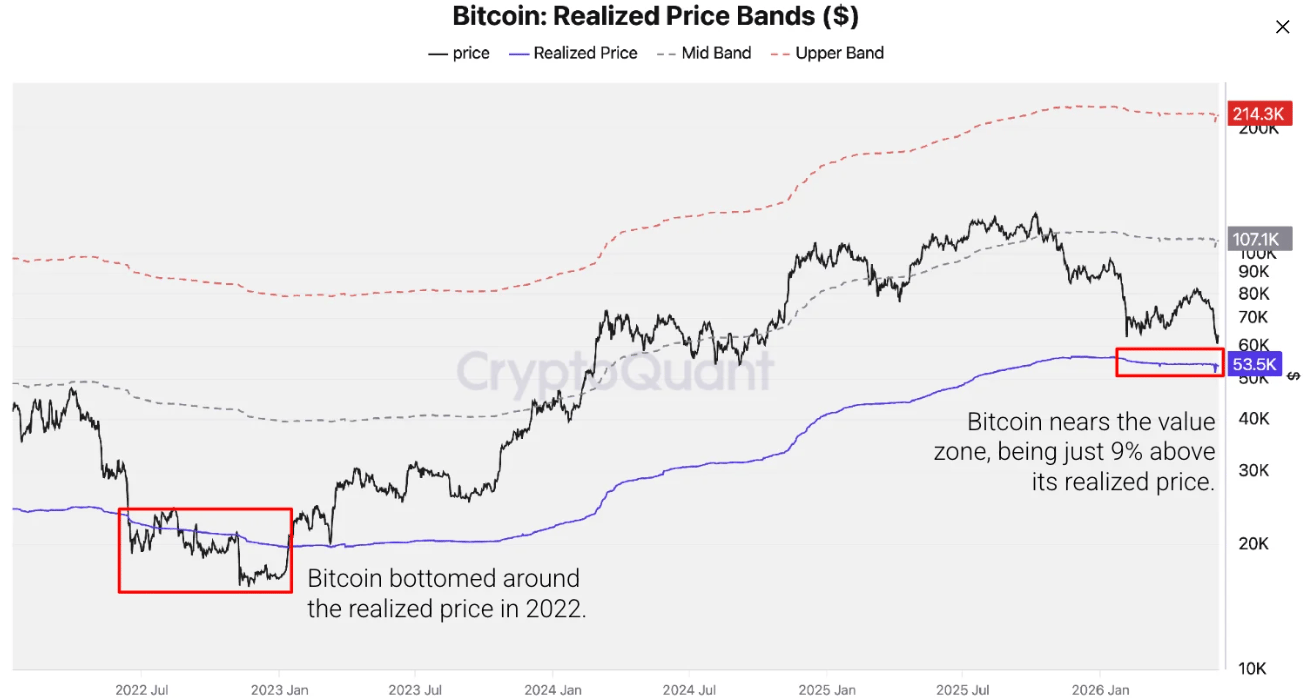
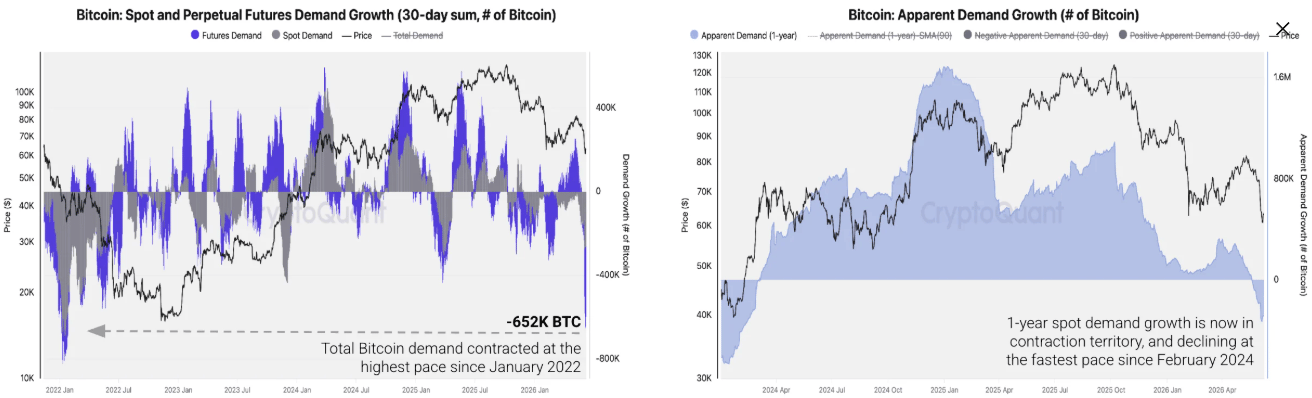
The report further explained, however, that a confirmed bear-market bottom or bullish reversal may still take time to develop. On-chain and derivatives data continue to show accelerating contraction in both speculative and apparent spot demand.
“The bottom may be near in terms of price level, but a regime change into a bull market requires a constructive demand recovery, a condition not yet visible in the data. Until total demand stabilizes, ETF flows recover, and realized losses reach capitulation-level peaks, the current price level should be interpreted as a valuation floor candidate, not a confirmed cycle bottom,” said the CryptoQuant analyst.
In an exclusive interview with FXStreet, Bitunix analyst Dean Chen said Bitcoin appears to be entering a bottom-building phase rather than having already confirmed a market bottom.
"Bitcoin does indeed appear closer to a mid-term bottoming zone," Chen said, adding that the market is transitioning from a distribution phase to an accumulation phase. Historically, most major bottoms form after leverage is wiped out and sentiment becomes extremely bearish — conditions that the current market is gradually meeting.
However, Chen cautioned that a new bull market is unlikely to emerge until global liquidity conditions improve and institutional investors regain confidence in increasing allocations to risk assets.
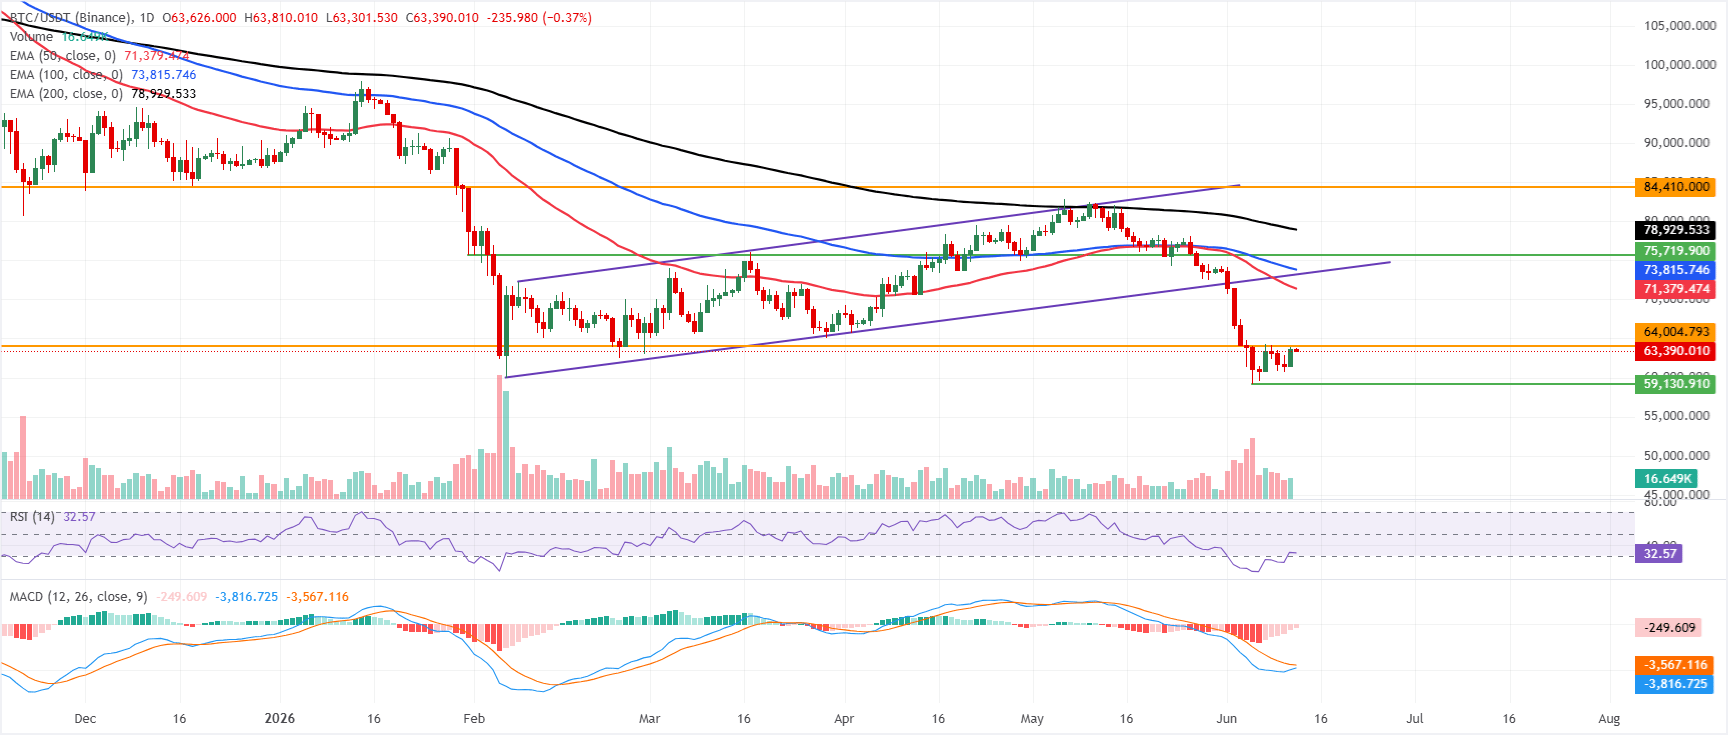
Technical outlook: BTC rebounds from the 200-week SMA
Bitcoin rebounds slightly, trading above $63,000 on Friday after retesting and finding support around the 200-week Simple Moving Average (SMA) at $62,023. The Crypto King has corrected over 23% from the May high of $82,800 to a new yearly low of $59,130 in the previous week.
If BTC continues its correction and closes below the 200-Week SMA at $62,023 on a weekly basis, it could extend the decline toward the next weekly support at $55,777.
Momentum is mixed on the weekly chart, with signs of concern: the Relative Strength Index (RSI) is trending lower and nearing oversold territory, reading 34 on Friday. Meanwhile, the Moving Average Convergence Divergence (MACD) histogram remains in positive territory, indicating that bulls still retain some control, though the fading green bars suggest upside momentum is losing strength.
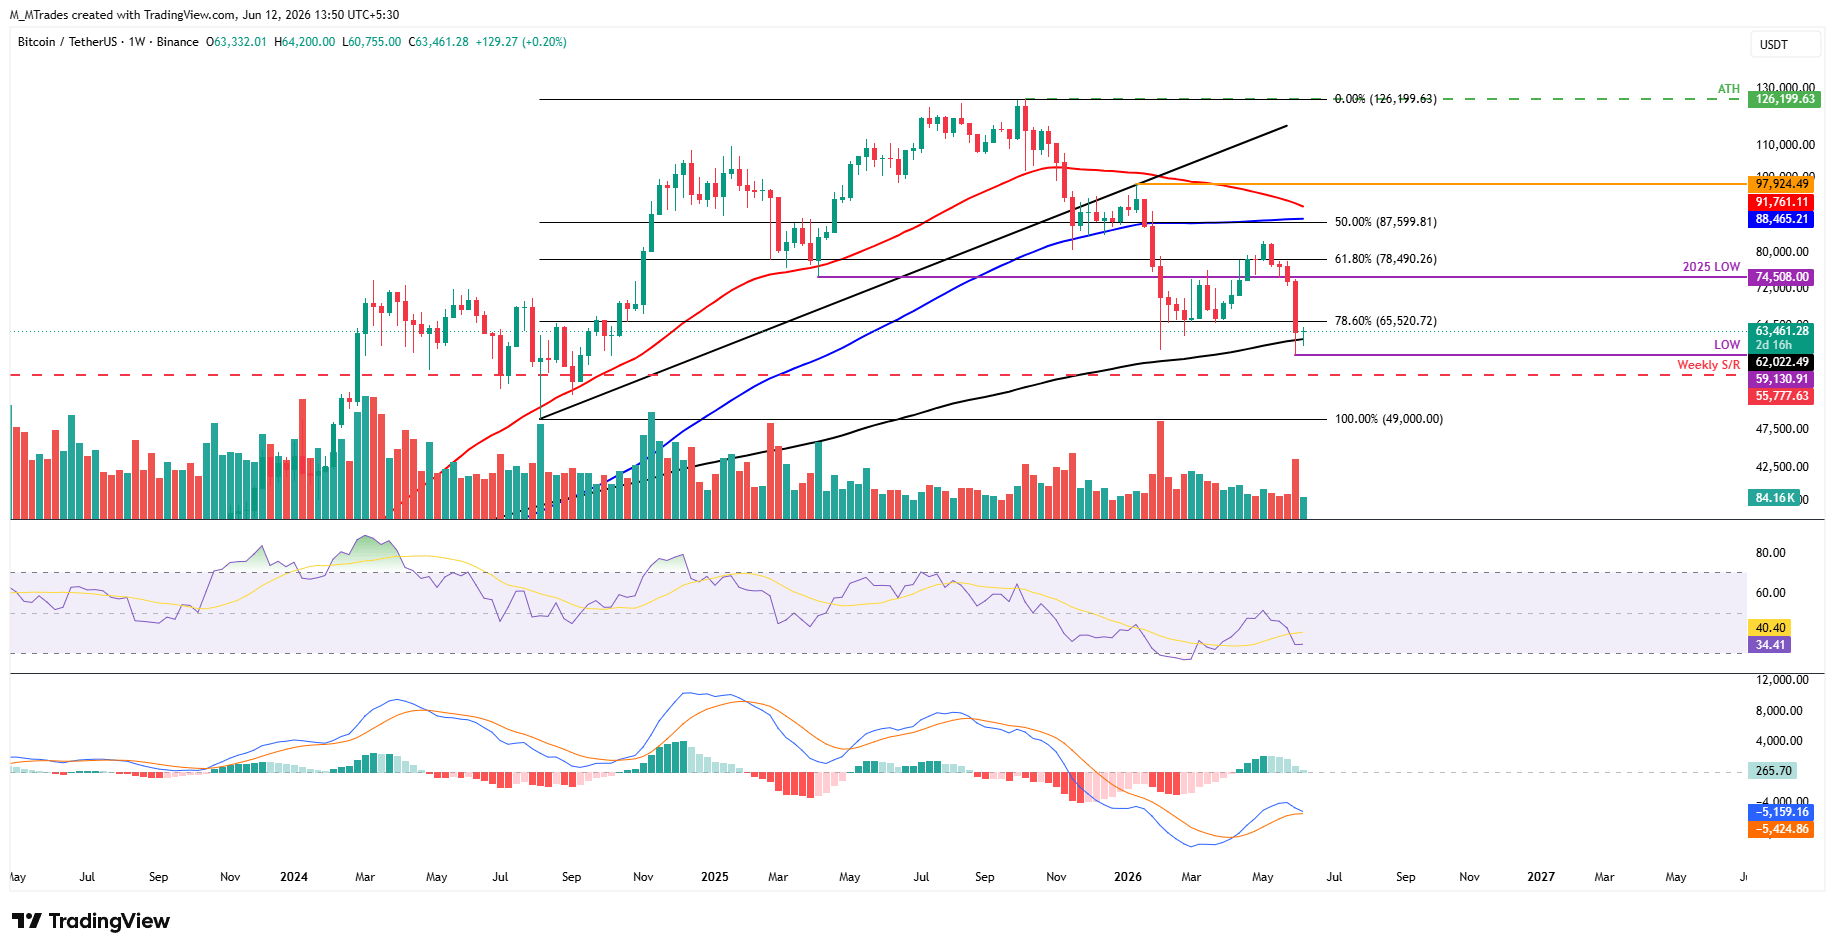
On the daily chart, BTC is maintaining a bearish bias and remains well below the 50-day, 100-day, and 200-day Exponential Moving Averages (EMAs) at roughly $71,389, $73,820, and $78,932, respectively.
The recent break and close under the prior rising trendline on June 1, which now comes in near $73,190, reinforces the notion of a market that has shifted from a trending advance into a corrective phase, while the RSI on the daily chart (stabilizing near 33) only hints at easing oversold conditions rather than a firm rebound, a view reinforced by the MACD – the line recovers toward zero but remains in negative territory.
On the topside, initial resistance is seen at the horizontal barrier around $64,004, with stronger supply expected at the 50-day EMA near $71,389 and the former uptrend support trendline turned resistance at about $73,190, followed by the 100-day EMA at $73,820 and the 200-day EMA closer to $78,932. A sustained recovery above these clustered moving averages would be needed to ease the broader downside pressure.
On the downside, with no nearby structural price floors in play, a bearish MACD and a subdued RSI reading suggest that any rebound is likely to be sold into while the pair trades beneath this heavy band of overhead resistance.
(The technical analysis of this story was written with the help of an AI tool.)
Bitcoin, altcoins, stablecoins FAQs
Bitcoin is the largest cryptocurrency by market capitalization, a virtual currency designed to serve as money. This form of payment cannot be controlled by any one person, group, or entity, which eliminates the need for third-party participation during financial transactions.
Altcoins are any cryptocurrency apart from Bitcoin, but some also regard Ethereum as a non-altcoin because it is from these two cryptocurrencies that forking happens. If this is true, then Litecoin is the first altcoin, forked from the Bitcoin protocol and, therefore, an “improved” version of it.
Stablecoins are cryptocurrencies designed to have a stable price, with their value backed by a reserve of the asset it represents. To achieve this, the value of any one stablecoin is pegged to a commodity or financial instrument, such as the US Dollar (USD), with its supply regulated by an algorithm or demand. The main goal of stablecoins is to provide an on/off-ramp for investors willing to trade and invest in cryptocurrencies. Stablecoins also allow investors to store value since cryptocurrencies, in general, are subject to volatility.
Bitcoin dominance is the ratio of Bitcoin's market capitalization to the total market capitalization of all cryptocurrencies combined. It provides a clear picture of Bitcoin’s interest among investors. A high BTC dominance typically happens before and during a bull run, in which investors resort to investing in relatively stable and high market capitalization cryptocurrency like Bitcoin. A drop in BTC dominance usually means that investors are moving their capital and/or profits to altcoins in a quest for higher returns, which usually triggers an explosion of altcoin rallies.
Author

Manish Chhetri
FXStreet
Manish Chhetri is a crypto specialist with over four years of experience in the cryptocurrency industry.


