CBA Elliott Wave forecast [Video]
![CBA Elliott Wave forecast [Video]](https://editorial.fxstreet.com/images/Markets/Equities/Industries/Pharma/man-microscope-pharma_XtraLarge.jpg)
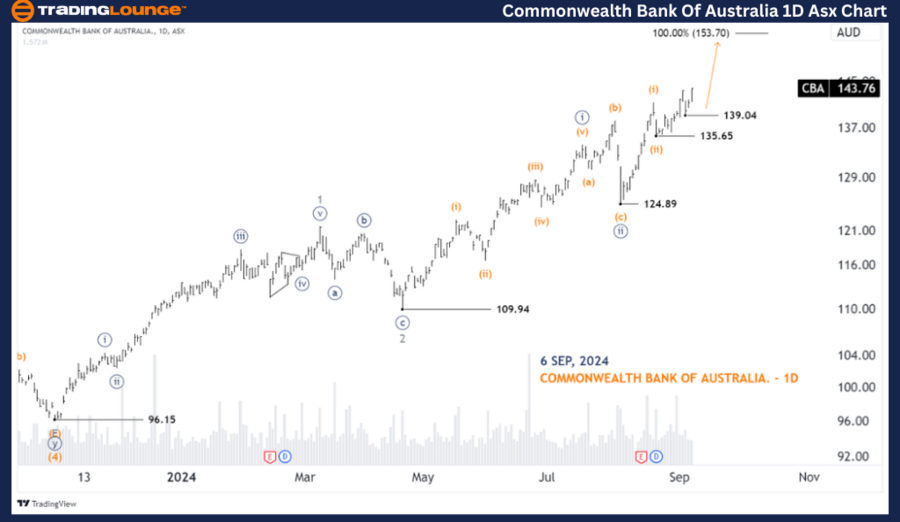
ASX: COMMONWEALTH BANK OF AUSTRALIA. - CBA Elliott Elliott Wave Technical Analysis TradingLounge (1D Chart)
Greetings, Our Elliott Wave analysis today updates the Australian Stock Exchange (ASX) with COMMONWEALTH BANK OF AUSTRALIA. - CBA. We see CBA.ASX with bullish potential with wave (iii) of ((iii)).
ASX: CBA one day chart (semilog scale) analysis
Function: Major trend (Minor degree, gray).
Mode: Motive.
Structure: Impulse.
Position: Wave (iii)-orange of Wave ((iii))-navy.
Details: Wave (ii)-orange ended earlier than expected, and wave (iii)-orange is unfolding to push higher. While the low of 139.04 may act as a temporary key level.
Invalidation point: 135.65.
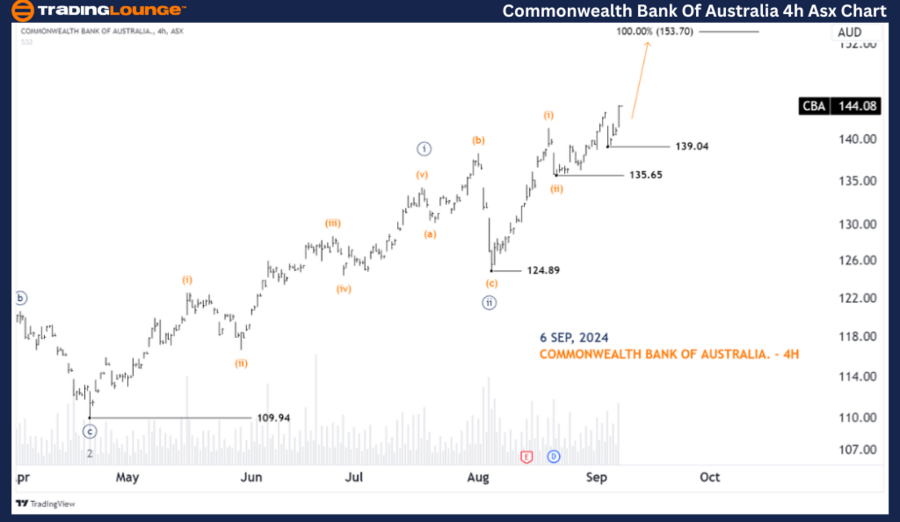
ASX: CBA four-hour chart analysis
Function: Major trend (Minor degree, gray).
Mode: Motive.
Structure: Impulse.
Position: Wave (iii)-orange of Wave ((iii))-navy.
Details: Wave (ii)-orange ended earlier than expected, and wave (iii)-orange is unfolding to push higher, targeting the high at 153.70. While price staying above 139.04 is a pretty good advantage for this bullish view.
Invalidation point: 135.65.
Conclusion
Our analysis, forecast of contextual trends, and short-term outlook for ASX: COMMONWEALTH BANK OF AUSTRALIA. - CBA aim to provide readers with insights into the current market trends and how to capitalize on them effectively. We offer specific price points that act as validation or invalidation signals for our wave count, enhancing the confidence in our perspective. By combining these factors, we strive to offer readers the most objective and professional perspective on market trends.
Technical analyst: Hua (Shane) Cuong, CEWA-M (Master’s Designation).
ASX: CBA four-hour chart analysis [Video]
Author

Peter Mathers
TradingLounge
Peter Mathers started actively trading in 1982. He began his career at Hoei and Shoin, a Japanese futures trading company.


