|

Cardano (ADA/USD) journeys toward $2 from blue box

Cardano is a decentralized blockchain platform and cryptocurrency (ADA) designed to provide a more secure and scalable infrastructure for the development of decentralized applications (dApps) and smart contracts. Launched in 2017 by the Cardano Foundation and developed by IOHK (Input Output Hong Kong), Cardano is unique for its research-driven approach, leveraging peer-reviewed academic studies to guide its development. It operates on a proof-of-stake consensus mechanism called Ouroboros, which enhances energy efficiency and network security.

Cardano completed a bearish cycle in June 2023. From June 2023 low, the cryptocurrency rallied in a 5-wave structure up to March 2024 before another pullback emerged and was completed in August 2024. Thus, the resultant rally emerges into another impulse structure. When the crypto breached the March 2024 high, we prepared to buy the next pullback if it completes a 3 or 7 swing structure as usual. 3-swing structures are zigzags while 7-swing structures are double zigzag Elliott wave patterns.

Cardano (ADA/USD) Elliott Wave chart – 12.11.2024
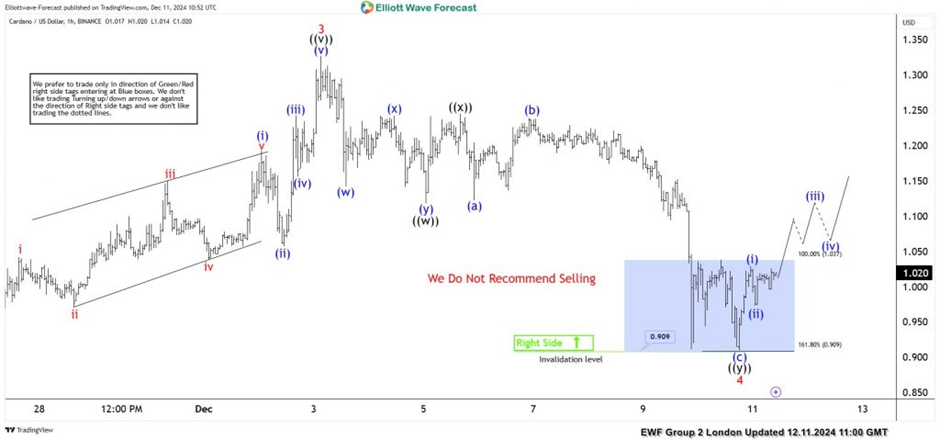
Chart

ADAUSD, H1

On 12.11.2024, we shared the chart above with members citing a 7-swing structure for wave 4 on the H1 chart. In addition, we identified the 1.037-0.909 as the key blue box zone. We expected new buyers from the blue box to cause at least a 3-swing bounce if not a 5-wave recovery for wave 5. Price reached the blue and bounced as we expected. For trade management, we advised members to take partial profit at 1.066.

Cardano (ADA/USD) Elliott Wave chart – 12.12.2024
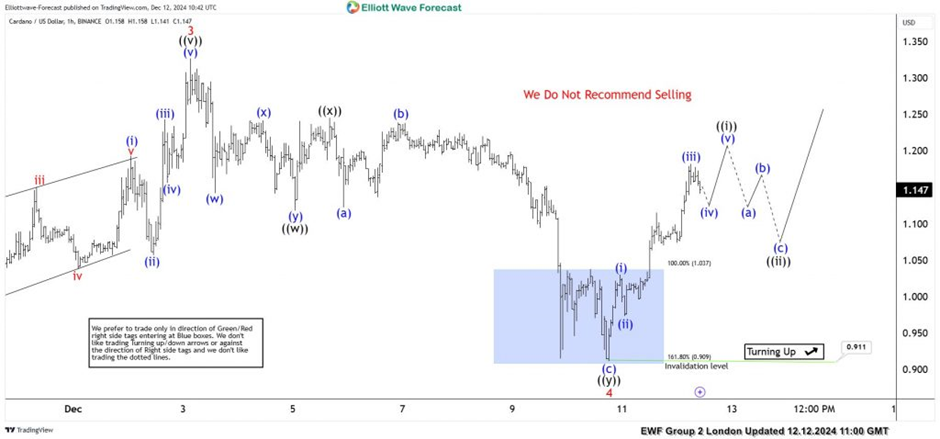
Chart

ADAUSD, H1

On 12.12.2024, a day after, we shared the chart above with members. The price shows a swift separation from the blue box just as we expected. In addition, price surpassed the risk-free area. Thus, traders now run a risk-free trade after taking partial profit. Going forward, we expect wave ((i)) of 5 to finish. Afterwards, a retracement in wave ((ii)) will follow. For as long as the pullback ends above 0.911, the upside should continue.

Author

Elliott Wave Forecast Team

Elliott Wave Forecast Team

ElliottWave-Forecast.com

More from Elliott Wave Forecast Team
Share:

Markets move fast. We move first.

Orange Juice Newsletter brings you expert driven insights - not headlines. Every day on your inbox.

By subscribing you agree to our Terms and conditions.

Editor's Picks

EUR/USD drops to daily lows near 1.1630

EUR/USD now loses some traction and slips back to the area of daily lows around 1.1630 on the back of a mild bounce in the US Dollar. Fresh US data, including the September PCE inflation numbers and the latest read on December consumer sentiment, didn’t really move the needle, so the pair is still on course to finish the week with a respectable gain.

GBP/USD trims gains, recedes toward 1.3320

GBP/USD is struggling to keep its daily advance, coming under fresh pressure and retreating to the 1.3320 zone following a mild bullish attempt in the Greenback. Even though US consumer sentiment surprised to the upside, the US Dollar isn’t getting much love, as traders are far more interested in what the Fed will say next week.

Gold makes a U-turn, back to $4,200

Gold is now losing the grip and receding to the key $4,200 region per troy ounce following some signs of life in the Greenback and a marked bounce in US Treasury yields across the board. The positive outlook for the precious metal, however, remains underpinned by steady bets for extra easing by the Fed.

Crypto Today: Bitcoin, Ethereum, XRP pare gains despite increasing hopes of upcoming Fed rate cut

Bitcoin is steadying above $91,000 at the time of writing on Friday. Ethereum remains above $3,100, reflecting positive sentiment ahead of the Federal Reserve's (Fed) monetary policy meeting on December 10.

Week ahead – Rate cut or market shock? The Fed decides

Fed rate cut widely expected; dot plot and overall meeting rhetoric also matter. Risk appetite is supported by Fed rate cut expectations; cryptos show signs of life. RBA, BoC and SNB also meet; chances of surprises are relatively low.

Ripple faces persistent bear risks, shrugging off ETF inflows

Ripple is extending its decline for the second consecutive day, trading at $2.06 at the time of writing on Friday. Sentiment surrounding the cross-border remittance token continues to lag despite steady inflows into XRP spot ETFs.