Breaking: Canadian inflation rose as expected in July

In July, Canada experienced a slight decrease in inflation, as the headline Consumer Price Index (CPI) recorded a 1.7% increase compared to the same month last year. This figure marks a decline from June’s 1.9% rise and matches earlier projections, according to Statistics Canada. On a monthly basis, the CPI rose by 0.3%, an uptick from the 0.1% increase recorded in the previous month.
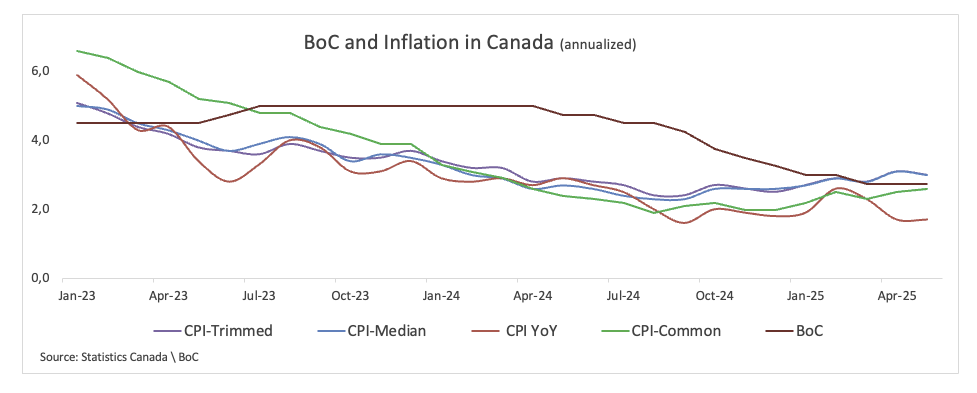
The core CPI monitored by the Bank of Canada (BoC), which excludes volatile elements like food and energy, experienced a year-over-year increase of 2.6% and a monthly rise of 0.1%.
When it comes to monetary policy, the BoC’s closely-watched inflation gauges saw the Common CPI rising at an annualised 2.6%, the Trimmed CPI up by 3.0%, and the Median CPI gaining 3.1% over the last twelve months.
According to the press release: “Prices for gasoline led the slowdown in the all-items CPI, falling 16.1% year over year in July, following a 13.4% decline in June. Excluding gasoline, the CPI rose 2.5% in July, matching the increases in May and June. Moderating the deceleration in July were higher prices for groceries and a smaller year-over-year decline in natural gas prices compared with June.”
Market reaction
The Canadian Dollar (CAD) loses ground and lifts USD/CAD to the area of muti-day highs near 1.3830 in the wake of the release of Canadian inflation data in July.
Canadian Dollar PRICE Today
The table below shows the percentage change of Canadian Dollar (CAD) against listed major currencies today. Canadian Dollar was the strongest against the Australian Dollar.
| USD | EUR | GBP | JPY | CAD | AUD | NZD | CHF | |
|---|---|---|---|---|---|---|---|---|
| USD | -0.15% | 0.00% | 0.06% | 0.21% | 0.15% | 0.02% | -0.24% | |
| EUR | 0.15% | 0.13% | 0.10% | 0.36% | 0.20% | 0.17% | -0.09% | |
| GBP | -0.00% | -0.13% | -0.16% | 0.23% | 0.11% | 0.03% | -0.22% | |
| JPY | -0.06% | -0.10% | 0.16% | 0.21% | 0.15% | -0.02% | -0.24% | |
| CAD | -0.21% | -0.36% | -0.23% | -0.21% | -0.06% | -0.20% | -0.45% | |
| AUD | -0.15% | -0.20% | -0.11% | -0.15% | 0.06% | -0.07% | -0.33% | |
| NZD | -0.02% | -0.17% | -0.03% | 0.02% | 0.20% | 0.07% | -0.26% | |
| CHF | 0.24% | 0.09% | 0.22% | 0.24% | 0.45% | 0.33% | 0.26% |
The heat map shows percentage changes of major currencies against each other. The base currency is picked from the left column, while the quote currency is picked from the top row. For example, if you pick the Canadian Dollar from the left column and move along the horizontal line to the US Dollar, the percentage change displayed in the box will represent CAD (base)/USD (quote).
This section below was published as a preview of the Canadian inflation report for January at 08:00 GMT.
- Canadian inflation is expected to tick higher on a monthly basis in July.
- The headline Consumer Price Index is seen declining to 1.7% YoY.
- The Canadian Dollar remains mired within a consolidation range.
Statistics Canada will issue the Consumer Price Index (CPI) for July on Tuesday. This will attract the market's attention since it will provide the Bank of Canada (BoC) with fresh information on how inflation is changing, which they use to set interest rates.
Economists anticipate that the headline inflation rate will fall to 1.7% in July, below June’s 1.9%. On a monthly basis, the inflation is seen gaining 0.4%.
The BoC will also release its core inflation measure, which excludes food and energy costs. In June, this primary indicator was 2.7% higher than in the same month the previous year and up 0.1% from a month earlier.
Even while there are indications that pricing pressure is reducing, analysts are still quite worried about the possibility of US tariffs causing domestic inflation to rise. Both markets and policymakers are anticipated to be circumspect in the coming weeks since the inflation forecast is now less clear.
What can we expect from Canada’s inflation rate?
The Bank of Canada left its benchmark rate unchanged at 2.75% on July 30, a move that broadly matched market expectations.
In his press conference, Governor Tiff Macklem said the bank’s decision to hold rates steady was influenced by fresh signs of stickiness in underlying inflation. He pointed out that the BoC’s preferred core measures — the trim mean and trim median — have been hovering around 3%, while a broader set of indicators has also edged higher. That shift, he acknowledged, has caught policymakers’ attention and will be watched closely in the months ahead.
At the same time, Macklem sought to reassure that not all of the recent strength in inflation is likely to persist. He argued that several forces should help ease price pressure: the Canadian Dollar (CAD) has regained ground after a bout of weakness, wage growth has slowed, and the economy remains in excess supply, with output thought to have contracted in the second quarter. In his view, these dynamics should combine to put downward pressure on inflation as the year progresses.
Markets will react to the headline number, but policymakers will be looking under the hood at the trim, median and common measures. According to the latest releases, the trim and median gauges have picked up pace, raising concerns among policymakers. The common gauge, however, has been more subdued.
When is the Canada CPI data due, and how could it affect USD/CAD?
Statistics Canada will release its July inflation data on Tuesday at 12:30 GMT, and markets are bracing for signs that price pressure could re-emerge.
A stronger-than-expected print would support the view that tariff-related costs are beginning to feed into consumer prices. That could push the BoC to tread more cautiously, lending short-term support to the Canadian Dollar (CAD) while also keeping a close eye on developments on the trade front.
FXStreet’s senior analyst, Pablo Piovano, notes that the CAD has settled into a range-bound pattern so far in August, with USD/CAD holding close to the 1.3800 area. He argues that renewed selling pressure could initially drive the pair back toward its provisional 55-day Simple Moving Average (SMA) at 1.3699, ahead of the monthly floor at 1.3721 (August 7). South from here emerge minor support levels at 1.3575 (weekly trough on July 23) and then the July valley at 1.3556 (July 3), all preceding the 2025 bottom of 1.3538 set on June 16.
On the topside, Piovano sees resistance at the August ceiling at 1.3879 (August 1), prior to the May peak at 1.4015 (May 13), which is bolstered by the critical 200-day SMA at 1.4031.
From a broader view, he suggests that the bearish bias will persist as long as spot trades below its 200-day SMA.
He also argues that momentum signals remain inconclusive: the Relative Strength Index (RSI) has retreated to nearly the 56 mark, suggesting some loss of upside impulse as of late, while the Average Directional Index (ADX) near 20 is indicative that the prevailing trend is slowly gaining steam.
Inflation FAQs
Inflation measures the rise in the price of a representative basket of goods and services. Headline inflation is usually expressed as a percentage change on a month-on-month (MoM) and year-on-year (YoY) basis. Core inflation excludes more volatile elements such as food and fuel which can fluctuate because of geopolitical and seasonal factors. Core inflation is the figure economists focus on and is the level targeted by central banks, which are mandated to keep inflation at a manageable level, usually around 2%.
The Consumer Price Index (CPI) measures the change in prices of a basket of goods and services over a period of time. It is usually expressed as a percentage change on a month-on-month (MoM) and year-on-year (YoY) basis. Core CPI is the figure targeted by central banks as it excludes volatile food and fuel inputs. When Core CPI rises above 2% it usually results in higher interest rates and vice versa when it falls below 2%. Since higher interest rates are positive for a currency, higher inflation usually results in a stronger currency. The opposite is true when inflation falls.
Although it may seem counter-intuitive, high inflation in a country pushes up the value of its currency and vice versa for lower inflation. This is because the central bank will normally raise interest rates to combat the higher inflation, which attract more global capital inflows from investors looking for a lucrative place to park their money.
Formerly, Gold was the asset investors turned to in times of high inflation because it preserved its value, and whilst investors will often still buy Gold for its safe-haven properties in times of extreme market turmoil, this is not the case most of the time. This is because when inflation is high, central banks will put up interest rates to combat it. Higher interest rates are negative for Gold because they increase the opportunity-cost of holding Gold vis-a-vis an interest-bearing asset or placing the money in a cash deposit account. On the flipside, lower inflation tends to be positive for Gold as it brings interest rates down, making the bright metal a more viable investment alternative.
Interest rates FAQs
Interest rates are charged by financial institutions on loans to borrowers and are paid as interest to savers and depositors. They are influenced by base lending rates, which are set by central banks in response to changes in the economy. Central banks normally have a mandate to ensure price stability, which in most cases means targeting a core inflation rate of around 2%. If inflation falls below target the central bank may cut base lending rates, with a view to stimulating lending and boosting the economy. If inflation rises substantially above 2% it normally results in the central bank raising base lending rates in an attempt to lower inflation.
Higher interest rates generally help strengthen a country’s currency as they make it a more attractive place for global investors to park their money.
Higher interest rates overall weigh on the price of Gold because they increase the opportunity cost of holding Gold instead of investing in an interest-bearing asset or placing cash in the bank. If interest rates are high that usually pushes up the price of the US Dollar (USD), and since Gold is priced in Dollars, this has the effect of lowering the price of Gold.
The Fed funds rate is the overnight rate at which US banks lend to each other. It is the oft-quoted headline rate set by the Federal Reserve at its FOMC meetings. It is set as a range, for example 4.75%-5.00%, though the upper limit (in that case 5.00%) is the quoted figure. Market expectations for future Fed funds rate are tracked by the CME FedWatch tool, which shapes how many financial markets behave in anticipation of future Federal Reserve monetary policy decisions.
Author
FXStreet Team
FXStreet
Composed of a group of economic journalists and FX experts, the FXStreet content team produces and oversees all content published on FXStreet. It provides a purely journalistic approach to the Forex market.


