Cameco Corp.: Support can be found at the $75 area

SIA Charts’ relative strength rankings help investors identify opportunities in stocks which are outperforming their peers or index benchmarks on a relative basis. Outperformance often reflects improving investor expectations for strong company growth or sector growth. The rankings not only help investors to identify which stocks in a universe are outperforming and underperforming against their peers, but also when relative performance trends are changing.
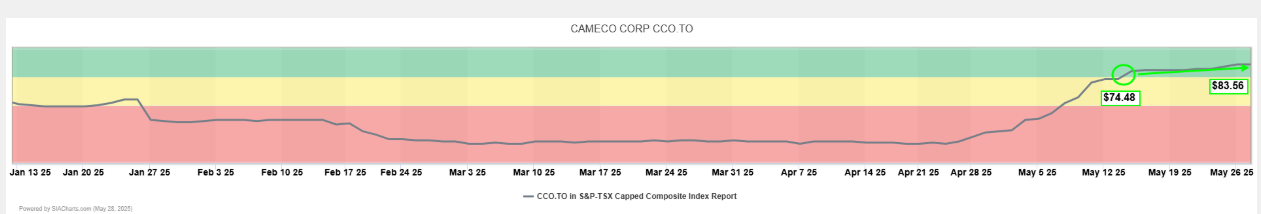
Cameco Corp. (CCO.TO) recently entered the Favored Zone of the SIA S&P/TSX Composite Index report on May 14th when the shares closed at $74.48. It is showing extremely strong relative strength moves up the S&P/TSX Composite Index report gaining 1 spot in the last day, 10 spots in the last week, 140 spots in the last month and 151 spots in the last quarter exemplifying the consistent money flow increases in the shares over the past little while. Currently the shares reside in the 32nd spot out of 219 positions in the report with yesterday’s closing price of $83.56 representing a 12.2% gain so far since its entry in the favored zone.
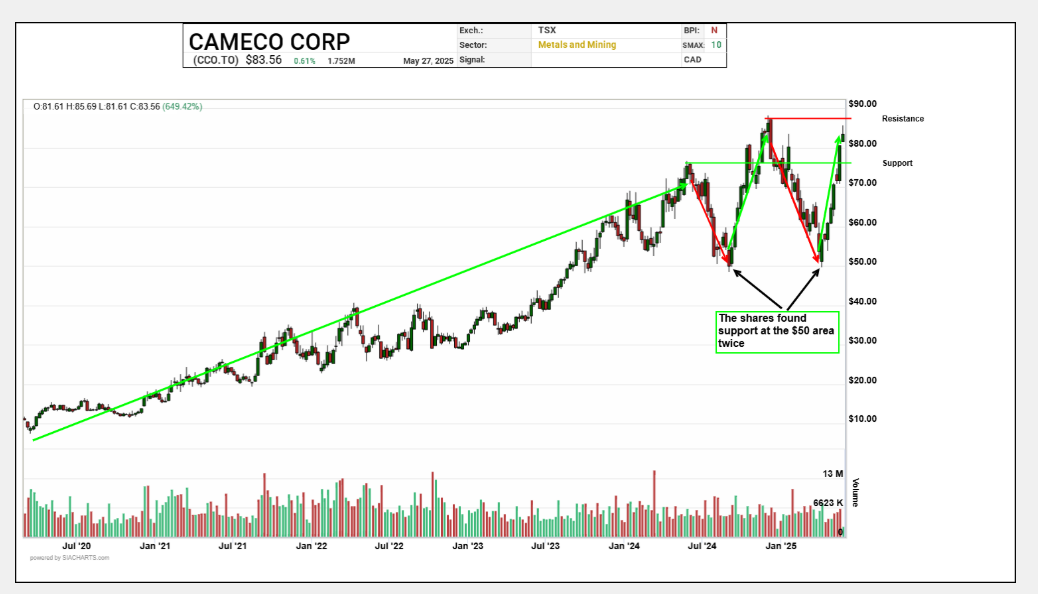
In looking at the attached candlestick chart of CCO.TO, we see the shares trend upwards from the Spring of 2020 up until June of 2024 when the shares hit the mid $75 range. A sharp pullback ensued from that point until early September of last year when the shares found a floor at the $50 area. After that, the shares charged upwards again establishing a new high before bumping its head at the $87 level back last December. Another sharp pullback ensued but the shares found a floor once again at the $50 area earlier last month.
Currently the shares are charging upwards and are quickly approaching the $87 celling which will act as important resistance. It will be interesting to see if the shares can break above this upcoming resistance level and establish a new upleg. Support can be found at the $75 area which was the prior high back in June of 2024.
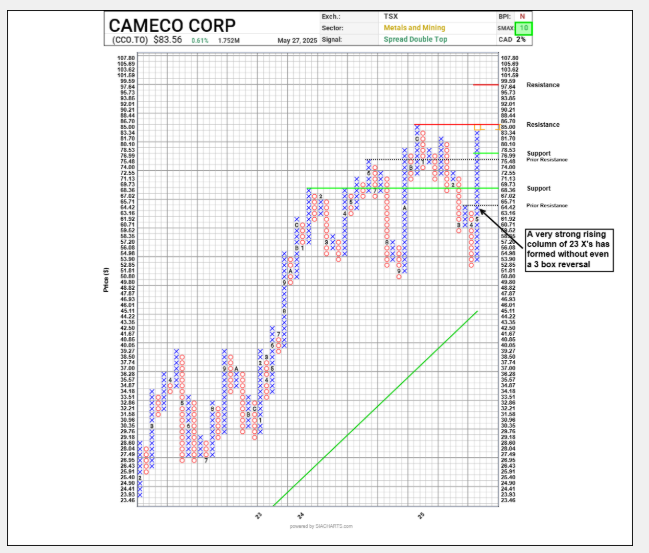
In looking at the Point and Figure Chart at a 2% scale for an investment grade analysis, we see the shares have been very strong with a rising column of X’s lasting 23 boxes without even a 3-box reversal. The shares have also broken above prior resistance levels at the $65, $69 and $77 area this month alone. The next level of resistance upcoming is the recent high of $86.70 which will be an important level to watch. If the shares do manage to break above this upcoming resistance point, a new leg and all time high will form and the shares will then enter new discovery territory with next resistance becoming the $100 whole number and psychological level. On the downside, support is at its 3-box reversal of $76.99 and, below that, $68.36. The shares currently exhibit a bullish Spread Double Top pattern and with an SMAX score of a perfect 10 out of 10, the shares are exhibiting strong near-term strength against the asset classes.
Unlock exclusive gold and silver trading signals and updates that most investors don’t see. Join our free newsletter now!
Unlock exclusive gold and silver trading signals and updates that most investors don’t see. Join our free newsletter now!
Author

CMT Association Research Team
CMT Association
The CMT Association is a global credentialing body that has served the financial industry for nearly 50 years.


