|

Cameco (CCJ) still sideways and looking for direction

Cameco Corporation (ticker: $CCJ) is the world’s largest publicly traded uranium company, based in Saskatoon, Saskatchewan, Canada. In 2015, it was the world’s second largest uranium producer, accounting for 18% of world production. This article provides the Elliott Wave technical outlook of the company.

$CCJ monthly Elliott Wave chart

Chart

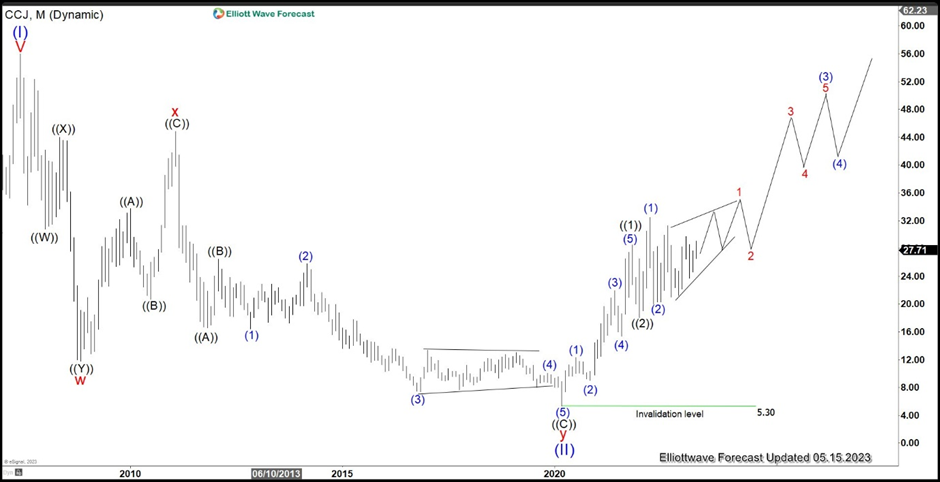
Monthly chart of Cameco above shows the stock ended wave (II) at 5.30 and it has resumed higher in wave (III). Up from wave (II), wave ((1)) ended at $28.49 and wave ((2)) completed at 18.03. The stock has resumed higher in wave ((3)). Wave (1) ended at 32.49 and pullback in wave (2) ended at 20.02. It has traded sideways since May last year looking for the next direction. We have a bullish bias and thus calling it higher as a diagonal within wave 1 of (3). However, this view still needs validation by breaking above wave (1).

$CCJ daily Elliott Wave chart

Chart

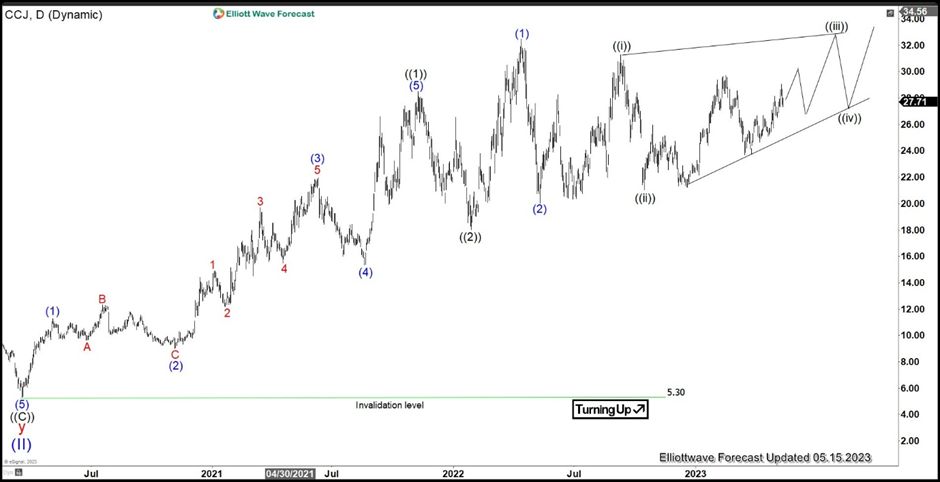
Daily Chart of $CCJ above shows that the stock has traded sideways in the past year. The stock needs to either break above wave (1) or below wave (2) to show us the next direction. Either way, we are bullish against wave (II) low at 5.30. Break above wave (1) would confirm the bullish sequence and opens more upside. Break below wave (2) on the other hand suggests a double correction within wave (2). As far as pivot at 5.3 low stays intact, expect pullback to find support in 3, 7, or 11 swing for further upside.

Author

Elliott Wave Forecast Team

Elliott Wave Forecast Team

ElliottWave-Forecast.com

More from Elliott Wave Forecast Team
Share:

Markets move fast. We move first.

Orange Juice Newsletter brings you expert driven insights - not headlines. Every day on your inbox.

By subscribing you agree to our Terms and conditions.

Editor's Picks

EUR/USD bears await break below 100-day SMA support near 1.1665 area

The EUR/USD pair attracts heavy selling for the second straight day and dives to a nearly four-week trough, around the 1.1670 region, during the Asian session on Monday. Bearish traders now await a sustained break below the 100-day Simple Moving Average before positioning for an extension of the recent pullback from a three-month top, or levels just above the 1.1800 mark touched on December 24.

GBP/USD falls toward 1.3400 near 50-day EMA

GBP/USD extends its losses for the second successive session, trading around 1.3420 during the Asian hours on Monday. The technical analysis of the daily chart indicates that the 14-day Relative Strength Index at 53 has eased from near overbought, indicating that momentum has cooled while remaining above the midline. RSI holds above 50, keeping a modest bullish bias.

Gold on fire at the start of the week on US-Venezuela tensions

Gold regains upside traction early Monday as flight to safety prevails on Venezuela turmoil. The US Dollar finds strong haven demand, caps Gold’s upside as focus shifts to US jobs data. Gold’s daily technical setup suggests that more upside remains in the offing.

Bulls firmly in control as Bitcoin breaks $93K, Ethereum and Ripple extend gains

Bitcoin, Ethereum, and Ripple extended their rallies on Monday, gaining more than 4%, 6%, and 12%, respectively, in the previous week. The top three cryptocurrencies by market capitalization could continue to outperform, with bulls in control of the momentum.

Economic outlook 2026-2027 in advanced countries: Solidity test

After a year marked by global economic resilience and ending on a note of optimism, 2026 looks promising and could be a year of solid economic performance. In our baseline scenario, we expect most of the supportive factors at work in 2025 to continue to play a role in 2026.

Crypto market outlook for 2026

Year 2025 was volatile, as crypto often is.  Among positive catalysts were favourable regulatory changes in the U.S., rise of Digital Asset Treasuries (DAT), adoption of AI and tokenization of Real-World-Assets (RWA).