|

Cameco (CCJ) – Impulse structure unfolding from April 2025 base

Cameco Corporation (CCJ), a leading global producer of uranium, plays a pivotal role in the nuclear energy supply chain, mining and refining uranium. Headquartered in Canada, the company benefits from long-term contracts and a strong position in an industry poised for growth amid rising demand for clean, reliable energy. We will look at the long term Elliott Wave path in this blog.

Cameco ($CCJ) Monthly Elliott Wave chart

Chart

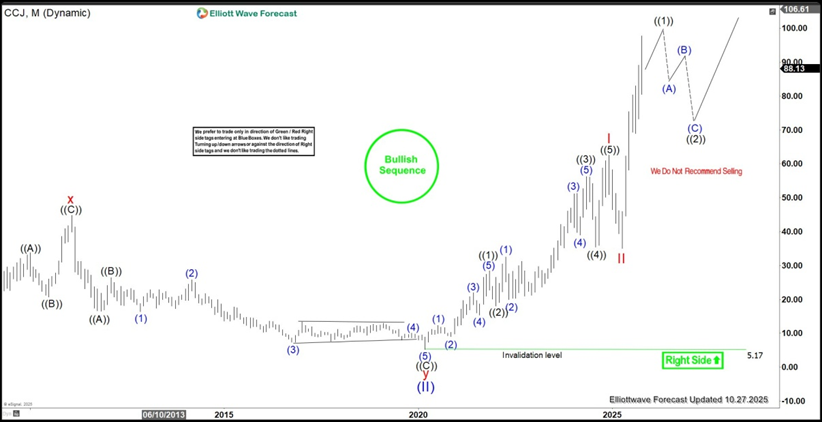
The monthly Elliott Wave chart for Cameco (CCJ) reveals that the stock completed a major long-term correction, labeled wave (II), at a low of $5.17. From this base, Cameco has initiated a new bullish cycle with substantial upside potential in the coming years. The stock is currently advancing in wave (III). From the wave (II) low, wave I peaked at $62.55. Wave II pullback followed to $35 in April 2025. The stock has since nested higher into wave III. Another leg up is expected to complete wave ((1)) of III. A subsequent pullback in wave ((2)) should follow before the uptrend resumes.

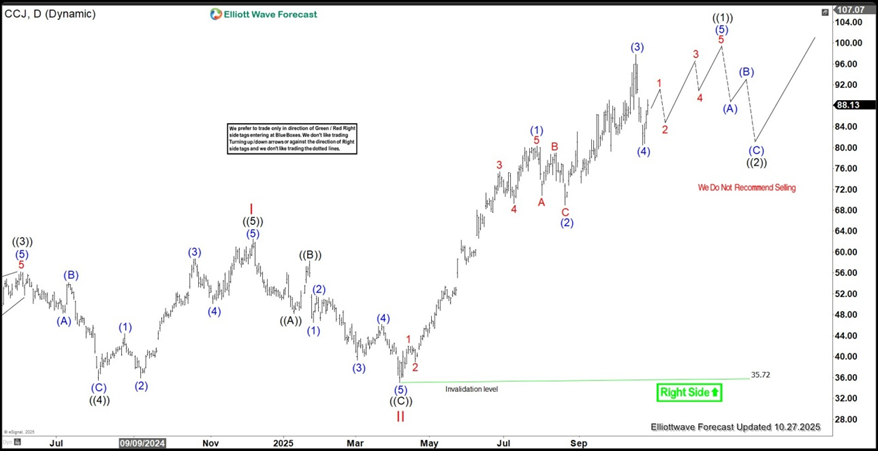
$CCJ daily Elliott Wave chart

Chart

Author

Elliott Wave Forecast Team

Elliott Wave Forecast Team

ElliottWave-Forecast.com

More from Elliott Wave Forecast Team
Share:

Editor's Picks

EUR/USD makes a U-turn, focus on 1.1900

EUR/USD’s recovery picks up further pace, prompting the pair to retarget the key 1.1900 barrier amid further loss of momentum in the US Dollar on Wednesday. Moving forward, investors are expected to remain focused on upcoming labour market figures and the always relevant US CPI prints on Thursday and Friday, respectively.

GBP/USD sticks to the bullish tone near 1.3660

GBP/USD maintains its solid performance on Wednesday, hovering around the 1.3660 zone as the Greenback surrenders its post-NFP bounce. Cable, in the meantime, should now shift its attention to key UK data due on Thursday, including preliminary GDP gauges.

Gold holds on to higher ground ahead of the next catalyst

Gold keeps the bid tone well in place on Wednesday, retargeting the $5,100 zone per troy ounce on the back of modest losses in the US Dollar and despite firm US Treasury yields across the curve. Moving forward, the yellow metal’s next test will come from the release of US CPI figures on Friday.

Ripple Price Forecast: XRP sell-side pressure intensifies despite surge in addresses transacting on-chain 

Ripple (XRP) is edging lower around $1.36 at the time of writing on Wednesday, weighed down by low retail interest and macroeconomic uncertainty, which is accelerating risk-off sentiment.

US jobs data surprises to the upside, boosts stocks but pushes back Fed rate cut expectations

This was an unusual payrolls report for two reasons. Firstly, because it was released on  Wednesday, and secondly, because it included the 2025 revisions alongside the January NFP figure.

XRP sell-off deepens amid weak retail interest, risk-off sentiment

Ripple (XRP) is edging lower around $1.36 at the time of writing on Wednesday, weighed down by low retail interest and macroeconomic uncertainty, which is accelerating risk-off sentiment.