|

BYD Co. (1211.HK) emerges from correction, resumes strong uptrend

About BYD: China’s Electric Vehicle Market Leader

BYD Company Limited (ticker: 1211.HK on the Hong Kong Stock Exchange) is a Chinese multinational powerhouse based in Shenzhen. Originally a battery manufacturer, BYD has emerged as the world’s leading producer of plug-in electric vehicles, surpassing Tesla by 2022. By 2023, it had sold over 3 million new energy vehicles, driven by popular models like the affordable Dolphin and its innovative Blade Battery. Recently, the stock has surged to a new all-time high within Wave (III). Below, we explore its long-term Elliott Wave trajectory.

Monthly Elliott Wave perspective

Chart

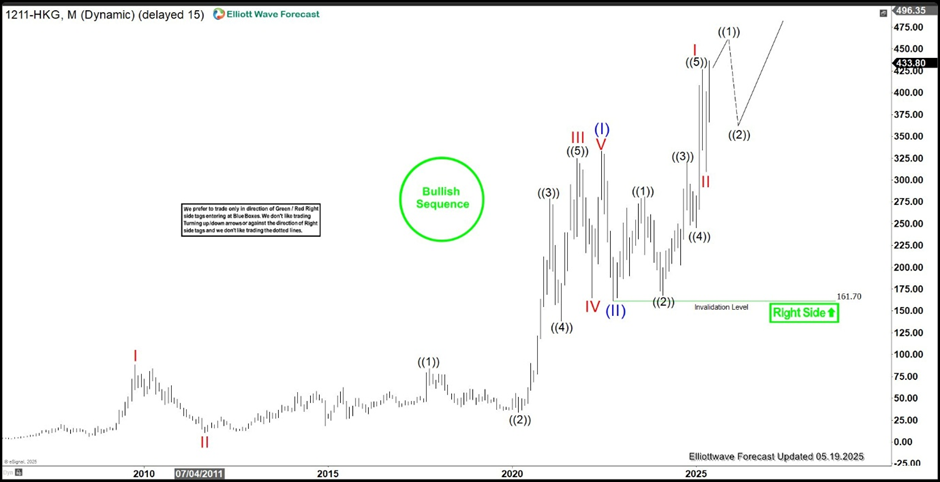
The monthly chart for BYD displays a completed Wave (I)-(II) structure, with the current price action indicating a breakout in Wave (III)

The monthly Elliott Wave chart for BYD illustrates a strong upward trend, with the stock reaching a new all-time high within Wave (III). From its all-time low, BYD rallied impulsively in five waves, completing Wave (I) at 333, followed by a Wave (II) pullback to 161.70. The stock then continued its ascent in Wave (III) as a nest. From the Wave (II) low, Wave I peaked at 426.60, with a subsequent Wave II pullback to 309.80. As BYD continues to break to new all-time highs and remains above 161.70, further upside is anticipated.

Daily chart breakdown

Chart

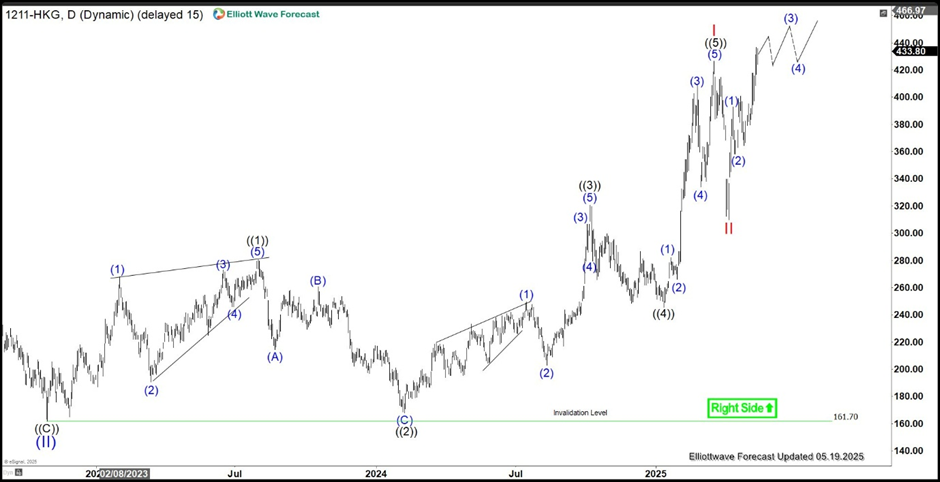
The daily chart for BYD illustrates the ongoing progression of Wave (III), featuring nested sub-waves within its structure

The daily Elliott Wave chart for BYD illustrates the stock’s ongoing rally within Wave (III). The structure shows Wave (I) peaking at 333, followed by a Wave (II) pullback to 161.70. From there, the stock advanced in Wave ((1)) to 280.60, with a Wave ((2)) pullback to 167.80. The rally resumed in Wave ((3)) to 320.80, followed by a Wave ((4)) dip to 245.50. The final Wave ((5)) completed at 426.60, marking the end of Wave I of (III). A subsequent pullback in Wave II of (III) concluded at 309.80, and the stock has since resumed its ascent to a new all-time high. As long as the pivot low at 161.70 holds, expect pullbacks to attract buyers in a 3, 7, or 11-swing sequence, supporting further upside.

Author

Elliott Wave Forecast Team

Elliott Wave Forecast Team

ElliottWave-Forecast.com

More from Elliott Wave Forecast Team
Share:

Markets move fast. We move first.

Orange Juice Newsletter brings you expert driven insights - not headlines. Every day on your inbox.

By subscribing you agree to our Terms and conditions.

Editor's Picks

EUR/USD tests nine-day EMA support near 1.1750

EUR/USD loses ground for the fourth consecutive session, trading around 1.1760 during the Asian hours on Monday. On the daily chart, technical analysis indicates a weakening bullish bias, as the pair tests to break below the lower boundary of the ascending channel pattern.

GBP/USD softens below 1.3500 but retains positive technical outlook

The GBP/USD pair loses momentum near 1.3485 during the early European session on Monday, pressured by renewed US Dollar demand. The potential downside for a major pair might be limited, as the Bank of England guided that monetary policy will remain on a gradual downward path.

Gold pulls back from record high as profit-taking sets in

Gold price retreats from a record high near $4,550 during the early European trading hours on Monday as traders book some profits ahead of holidays. A renewed US Dollar could also weigh on the precious metal, as it makes Gold more expensive for non-US buyers, pressuring prices.

Bitcoin, Ethereum, and XRP bulls regain strength

Bitcoin, Ethereum, and Ripple record roughly 3% gains on Monday, regaining strength mid-holiday season. Despite thin liquidity in the holiday season, BTC and major altcoins are regaining strength as US President Donald Trump pushes peace talks between Russia and Ukraine. The technical outlook for Bitcoin, Ethereum, and Ripple gradually shifts bullish as selling pressure wanes.

Economic outlook 2026-2027 in advanced countries: Solidity test

After a year marked by global economic resilience and ending on a note of optimism, 2026 looks promising and could be a year of solid economic performance. In our baseline scenario, we expect most of the supportive factors at work in 2025 to continue to play a role in 2026.

Avalanche struggles near $12 as Grayscale files updated form for ETF

Avalanche trades close to $12 by press time on Wednesday, extending the nearly 2% drop from the previous day. Grayscale filed an updated form to convert its Avalanche-focused Trust into an ETF with the US Securities and Exchange Commission.