Broadcom post-earnings: Bull flag pattern sets the stage for potential breakout

Broadcom Inc. (AVGO) continues to be a central protagonist in the AI semiconductor narrative. Following its earnings report after yesterday’s close, the company delivered a "beat and raise" performance, surpassing EPS estimates by 0.93% and revenue by 0.28%. Most importantly, management provided robust guidance fueled by accelerating demand for AI-specific networking and custom chips.
The market’s immediate reaction was a surge of over 5% in early trading, though price action moderated mid-day to a gain of approximately 3%. This volatility, however, has served a specific technical purpose: it has kept AVGO firmly within a high-conviction bull flag consolidation.
The structure of the flag
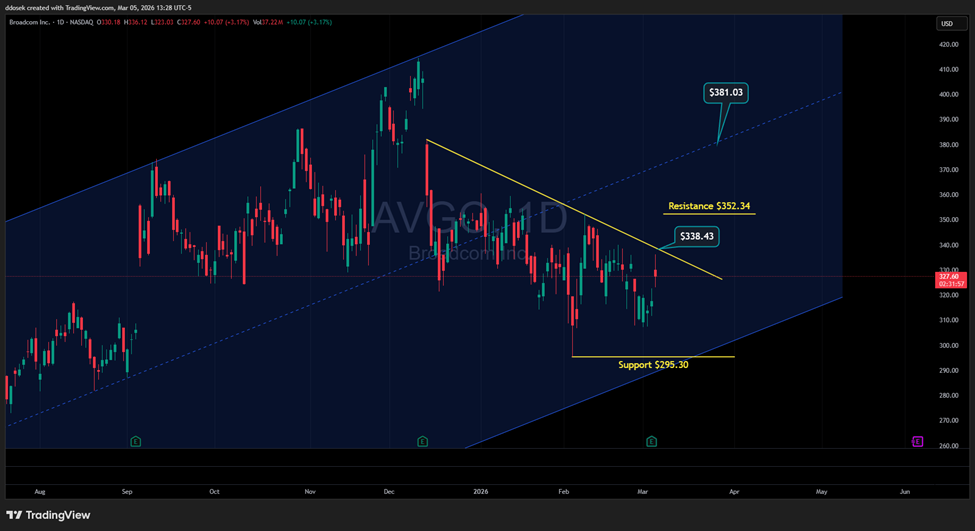
The technical setup for AVGO began with a sharp "flag pole" rally originating from the February 4th low pivot. The vertical ascent following that pivot established the momentum, while the sideways-to-downward drifting price action since then has carved out the "flag" portion of the pattern.
The $338.43 resistance trigger
For the bulls to confirm that this consolidation is over and a new leg higher has begun, they must overcome a specific technical hurdle: the declining trendline that forms the roof of the flag.
● Key Resistance: $338.43
● The Signal: A confirming daily close above this trendline would significantly increase the probabilities of the bull flag "playing out," typically resulting in a measured move higher.
The "double floor" support
What makes the AVGO chart so resilient right now is the confluence of support beneath current prices. The bull flag pattern is being "held up" by two major technical pillars:
- The Pivot Low: Support sits at the February 4th low of $295.30. A close below this would technically invalidate the bull flag.
- The Channel Boundary: Parallel to this pivot is the bottom rail of an inclining channel.
For the bears to reclaim control, they would need to push price through both of these layers. Such a move would be highly significant, as it would not only break the flag but also signal a breakdown of the larger parallel channel, potentially shifting the long-term trajectory from bullish to bearish.
Summary
Broadcom is currently a "show me" story. The fundamentals are backed by AI growth, and the technicals have formed a classic bullish continuation pattern. As long as the $295.30 support holds, the eyes of the market remain fixed on the $338.43 breakout level.
Key Technical Levels:
● Breakout Resistance: $338.43
● Critical Support (The Floor): $295.30
● Pattern Type: Bull Flag (Consolidation)
● Trend Status: Near-term Bullish / Consolidation
Author

Drew Dosek
Verified Investing
Passionate technical and cycle analyst committed to empowering traders through data-driven insights.