|

Boston Scientific Corporation (BSX) should continue uptrend and remain supported

Boston Scientific Corporation (BSX) develops, manufactures & markets medical devices for use in various interventional medical specialties worldwide. It operates through MedSurg & Cardiovascular segments. It offers devices to diagnose & treat different medical conditions and offer remote patient management systems. It is based in Marlborough, US, comes under Healthcare sector & trades as “BSX” ticker at NYSE.

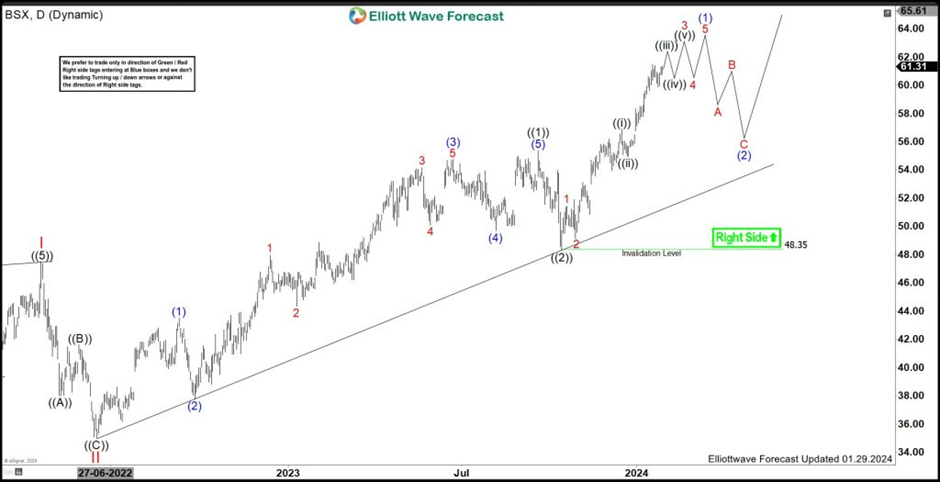
As discussed in previous article, BSX reacted higher since $48.35 low & extend higher within the sequence started from October-2023 low. It erased the momentum divergence in daily suggesting further upside to continue as ((3)) of III in impulse sequence.

BSX – Elliott Wave latest daily view

Chart

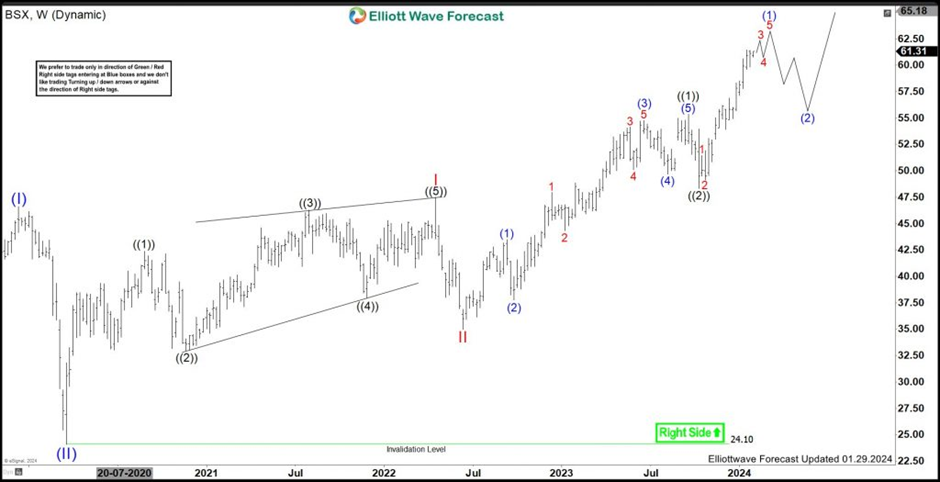
In weekly sequence, it placed (II) at $24.10 low in March-2020 & II of (III) at $34.98 low in June-2022. Above there, it favors upside in (1) of ((3)) of III & expect to remain supported in 3, 7 or 11 swings pullback. It placed ((1)) of I at $42.37 high, ((2)) at $32.99 low, ((3)) at $46.28 high, ((4)) at 37.96 low & ((5)) as I at $47.49 high. It placed ((1)) of III at $55.38 high & ((2)) at $48.35 low as shallow pullback. Within ((1)) of III, it placed (1) at $43.52 high, (2) at $37.74 low, (3) at $54.74 high, (4) at 49.69 low & finally (5) at $55.38 high as ((1)).

BSX – Elliott Wave latest weekly view

Chart

Above ((2)) low, it favors upside in ((iii)) of 3 & expect further higher to finish (1) of ((3)). It placed 1 of (1) at $51.43 high & 2 at $49.15 low as flat correction. Above there, it favored ended ((ii)) at $54.95 low & favors upside in ((iii)) of 3 of (1). It expects few more highs to finish (1) of ((3)) before the next pullback may starts in (2) correction, which unfold in 3, 7 or 11 swings before resume upside in (3) of ((3)).

Author

Elliott Wave Forecast Team

Elliott Wave Forecast Team

ElliottWave-Forecast.com

More from Elliott Wave Forecast Team
Share:

Editor's Picks

EUR/USD: Bears retain control below 1.1780-1.1770 confluence breakpoint

The EUR/USD pair remains on the back foot through the Asian session on Friday and currently trades just above mid-1.1700s, well within striking distance of a nearly one-month low set the previous day.

GBP/USD seems vulnerable near one-month low as traders await US data

The GBP/USD pair prolongs its weekly downtrend for the fifth consecutive day on Friday and slides back closer to a nearly one-month low, touched the previous day. Spot prices trade below mid-1.3400s during the Asian session on Friday and seem vulnerable to slide further as traders now look to important US macro data for a fresh impetus.

Gold eyes next breakout on US GDP, PCE inflation data

Gold sticks to recent gains around the $5,000-mark early Friday, biding time before the high-impact US macro events. The focus is now on the US fourth-quarter Gross Domestic Product, core Personal Consumption Expenditures Price Index and the Supreme Court’s ruling on President Donald Trump’s tariffs.

Bitcoin, Ethereum and Ripple remain range-bound as breakdown risks rise

Bitcoin, Ethereum, and Ripple are trading sideways within consolidation ranges on Friday, signaling a lack of directional bias in the broader crypto market. BTC rebounded from key support, and ETH is nearing the lower consolidation boundary, while XRP is holding at its lower trendline boundary. 

Hawkish Fed minutes and a market finding its footing

It was green across the board for US Stock market indexes at the close on Wednesday, with most S&P 500 names ending higher, adding 38 points (0.6%) to 6,881 overall. At the GICS sector level, energy led gains, followed by technology and consumer discretionary, while utilities and real estate posted the largest losses.

Official Trump price approaches breakout with mixed signals from traders

Official Trump (TRUMP) is trading at $3.50 at the time of writing, approaching its upper consolidation range. A breakout from this range could open the door for an upside move. On-chain data shows market indecision, with balanced flows between bulls and bears, signaling a lack of clear directional bias.