|

Boeing (BA) pullback structure looks corrective [Video]

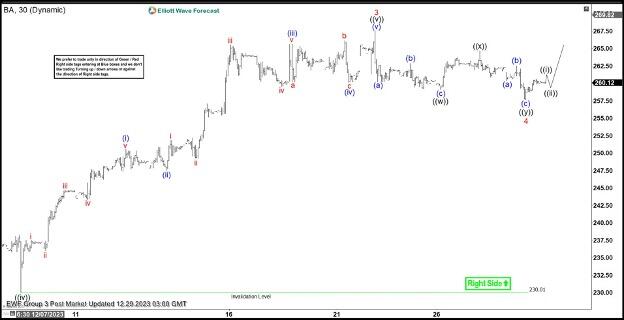
Short Term Elliott Wave View in Boeing (BA) suggests rally from 10.27.2023 low is in progress as a 5 waves impulse. Up from 10.27.2023 low, wave 1 ended at 197.14 and pullback in wave 2 ended at 189.57. The stock then resumed higher in wave 3. Up from wave 2, wave ((i)) ended at 211.09 and pullback in wave ((ii)) ended at 204.81. Boeing then extended higher in wave ((iii)) towards 239.23 and dips in wave ((iv)) ended at 230. Final leg wave ((v)) higher ended at 267.54 which completed wave 3. The 30 minutes chart below shows the rally from wave ((iv)).

Wave 4 pullback is proposed complete at 257.68. Internal subdivision of wave 4 unfolded as a double three Elliott Wave structure. Down from wave 3, wave (a) ended at 260.19 and wave (b) ended at 262.84. Wave (c) of ((w)) ended at 259.12. Rally in wave ((x)) ended at 264.66. Wave ((y)) lower ended at 257.68 which completed wave 4. Internal subdivision of wave ((y)) unfolded as a zigzag structure. Down from wave ((x)), wave (a) ended at 260.42 and wave (b) ended at 262.51. Wave (c) lower ended at 257.68 which completed wave ((y)) of 4. Near term, as far as pivot at 230.01 low stays intact, expect dips to find support in 3 ,7, or 11 swing for further upside.

Boeing (BA) 30 minutes Elliott Wave chart

BA Elliott Wave video

Author

Elliott Wave Forecast Team

Elliott Wave Forecast Team

ElliottWave-Forecast.com

More from Elliott Wave Forecast Team
Share:

Markets move fast. We move first.

Orange Juice Newsletter brings you expert driven insights - not headlines. Every day on your inbox.

By subscribing you agree to our Terms and conditions.

Editor's Picks

EUR/USD: Bulls pray for a dovish Fed

EUR/USD has finally taken a breather after a pretty energetic climb. The pair broke above 1.1680 in the second half of the week, reaching its highest levels in around two months before running into some selling pressure. Even so, it has gained almost two cents from the late-November dip just below 1.1500 the figure.

GBP/USD trims gains, recedes toward 1.3320

GBP/USD is struggling to keep its daily advance, coming under fresh pressure and retreating to the 1.3320 zone following a mild bullish attempt in the Greenback. Even though US consumer sentiment surprised to the upside, the US Dollar isn’t getting much love, as traders are far more interested in what the Fed will say next week.

Gold: Bullish momentum fades despite broad USD weakness

After rising more than 3.5% in the previous week, Gold has entered a consolidation phase and fluctuated at around $4,200. The Federal Reserve’s interest rate decision and revised Summary of Economic Projections, also known as the dot plot, could trigger the next directional move in XAU/USD. 

Week ahead: Rate cut or market shock? The Fed decides

Fed rate cut widely expected; dot plot and overall meeting rhetoric also matter. Risk appetite is supported by Fed rate cut expectations; cryptos show signs of life. RBA, BoC and SNB also meet; chances of surprises are relatively low. Dollar weakness could linger; both the aussie and the yen best positioned to gain further. Gold and oil eye Ukraine-Russia developments; a peace deal remains elusive.

Week ahead – Rate cut or market shock? The Fed decides

Fed rate cut widely expected; dot plot and overall meeting rhetoric also matter. Risk appetite is supported by Fed rate cut expectations; cryptos show signs of life. RBA, BoC and SNB also meet; chances of surprises are relatively low.

Ripple faces persistent bear risks, shrugging off ETF inflows

Ripple is extending its decline for the second consecutive day, trading at $2.06 at the time of writing on Friday. Sentiment surrounding the cross-border remittance token continues to lag despite steady inflows into XRP spot ETFs.