|

Boeing (BA) Elliott Wave view: Impulse lower suggest more downside [Video]

Boeing ticker symbol: BA ended a corrective cycle in January 24 at 217.59 high and we labeled as wave (B). Then the stock continued lower forming an impulse structure. Down from 24.01.2024 high, wave 1 ended at 198.32 low and bounce in wave 2 finished at 215.03 high. The market resumes lower in wave ((i)) ending at 197.15 low. Pullback in wave ((ii)) higher did a zigzag Elliott Wave structure ending at 208.10 high.

Boeing 60 minutes Elliott Wave chart

Chart

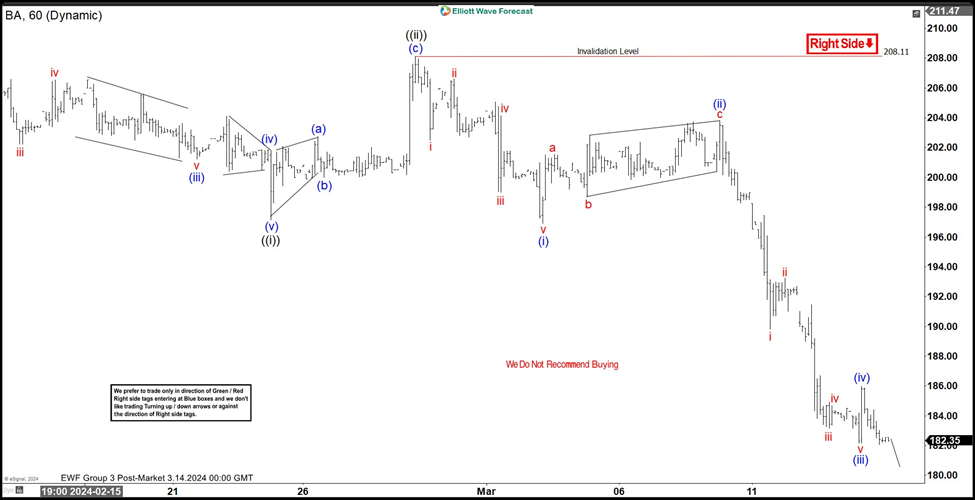
Boeing resumed to the downside in wave ((iii)) that is still in progress. Down from wave ((ii)) in lesser degree, wave i ended at 202.51  and wave ii pullback ended at 206.62. The stock resumes lower in wave iii towards 199.03 and bounce in wave iv ended at 204.15. Last wave v ended at 196.92 which completed wave (i) as a ending diagonal. Rally from 196.92 low ended at 203.80 and also wave (ii) correction. Then, the market drop strongly ended wave (iii) at 182.19 and small bounce to 185.97 end wave (iv) correction. Currently, we are expecting to complete wave (v) and also wave ((iii)) lower where market should react higher in correction as wave ((iv)) before resuming to the downside in wave ((v)) of 3.

Boeing Elliott Wave [Video]

Author

Elliott Wave Forecast Team

Elliott Wave Forecast Team

ElliottWave-Forecast.com

More from Elliott Wave Forecast Team
Share:

Editor's Picks

EUR/USD tests nine-day EMA support near 1.1850

EUR/USD remains in the negative territory for the fourth successive session, trading around 1.1870 during the Asian hours on Friday. The 14-day Relative Strength Index momentum indicator at 56 stays above the midline, confirming steady momentum. RSI has eased but remains above 50, indicating momentum remains constructive for the bulls.

GBP/USD consolidates around 1.3600 vs. USD; looks to US CPI for fresh impetus

The GBP/USD pair remains on the defensive through the Asian session on Friday, though it lacks bearish conviction and holds above the 1.3600 mark as traders await the release of the US consumer inflation figures before placing directional bets.

Gold recovers swiftly from weekly low, climbs back closer to $5,000 ahead of US CPI

Gold regains positive traction during the Asian session on Friday and recovers a part of the previous day's heavy losses to the $4,878-4,877 region, or the weekly low. The commodity has now moved back closer to the $5,000 psychological mark as traders keenly await the release of the US consumer inflation figures for more cues about the Federal Reserve's policy path.

Solana: Mixed market sentiment caps recovery

Solana is trading at $79 as of Friday, following a correction of over 9% so far this week. On-chain and derivatives data indicates mixed sentiment among traders, further limiting the chances of a price recovery.

A tale of two labour markets: Headline strength masks underlying weakness

Undoubtedly, yesterday’s delayed US January jobs report delivered a strong headline – one that surpassed most estimates. However, optimism quickly faded amid sobering benchmark revisions.

Solana Price Forecast: Mixed market sentiment caps recovery

Solana (SOL) is trading at $79 as of Friday, following a correction of over 9% so far this week. On-chain and derivatives data indicates mixed sentiment among traders, further limiting the chances of a price recovery.