BMW is one of the biggest german car manufacturers excelling in quality and technical characteristics. Investors and traders can trade the company stock under ticker $BMW in Frankfurt at XETRA. Back in April 2020, we were calling $BMW for a new bullish cycle. We were right, the price has more than doubled. Then, in the article from June 2021, we forecasted a pullback against March 2020 lows to happen. Indeed, $BMW has retraced part of the advance. Now, from March 2022 lows, we see another bullish cycle in progress. Another extension higher has been confirmed by breaking the January 2022 highs. Here, we present an updated view on $BMW stock, discuss the Elliott Wave structure, bullish sequences and provide targets.

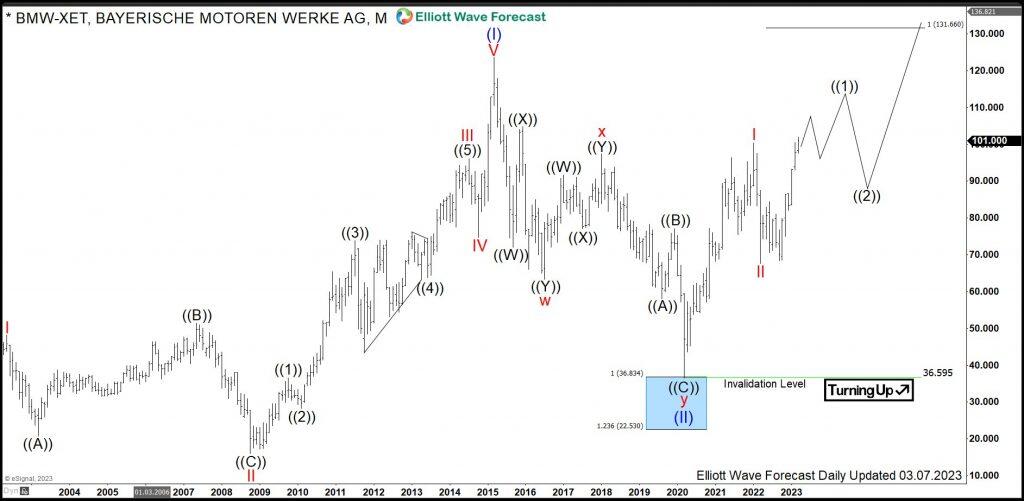
BMW monthly Elliott Wave analysis 03.08.2023

The monthly chart below shows $BMW traded at XETRA. From all-time lows, the stock price has developed an Elliott wave motive wave pattern. The cycle up in blue wave (I) being of super cycle degree has ended by printing the all-time highs on March 2015 at 123.75. Within the super cycle in wave (I), the red waves I, III and V of cycle degree are also motive waves. Moreover, wave III shows an extension.

From the March 2015 highs, a correction in wave (II) has unfolded as a double three pattern, i.e., a 7 swings structure. As correctly called in the initial article, it has printed an important bottom in March 2020 at 36.59. From there, a new cycle in blue wave (III) has started and should reach towards 123.75 highs and even higher.

BMW

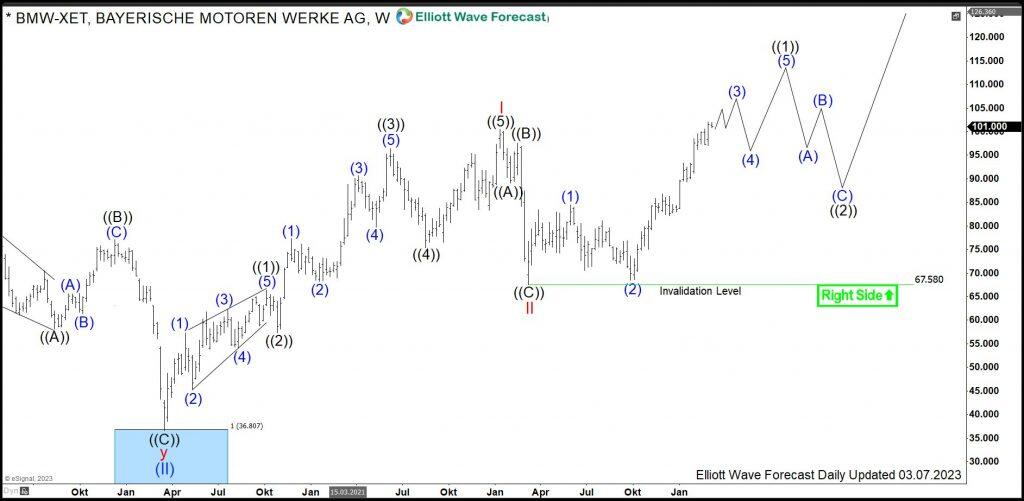
BMW weekly Elliott Wave analysis 03.08.2023

The weekly chart below shows in more detail the initial nest consisting of red waves I-II and the advance in red wave III of blue wave (III). First, red wave I of blue wave (III) has developed an impulse towards January 2022 highs at 100.42. From there, a pullback in red wave II has found a bottom at 67.58. While above March 2022 lows, red wave III is in progress. It has been confirmed by breaking 100.42 highs. Now, we see a bullish sequence. Therefore, while above 67.58 lows, red wave III can reach 131.66-171.21 area and possibly higher.

Investors should not chase the BMW stock at current prices. Since the world indices are in a choppy market conditions, it is reasonable to wait for a pullback in the BMW stock as well. Investors and traders can be looking to buy $BMW in a pullback against 67.58 lows in 3, 7 or 11 swings targeting 131.66-171.21 area in medium term and 159.70-235.90 area in a long run.

BMW

Share: Feed news

FURTHER DISCLOSURES AND DISCLAIMER CONCERNING RISK, RESPONSIBILITY AND LIABILITY Trading in the Foreign Exchange market is a challenging opportunity where above average returns are available for educated and experienced investors who are willing to take above average risk. However, before deciding to participate in Foreign Exchange (FX) trading, you should carefully consider your investment objectives, level of xperience and risk appetite. Do not invest or trade capital you cannot afford to lose. EME PROCESSING AND CONSULTING, LLC, THEIR REPRESENTATIVES, AND ANYONE WORKING FOR OR WITHIN WWW.ELLIOTTWAVE- FORECAST.COM is not responsible for any loss from any form of distributed advice, signal, analysis, or content. Again, we fully DISCLOSE to the Subscriber base that the Service as a whole, the individual Parties, Representatives, or owners shall not be liable to any and all Subscribers for any losses or damages as a result of any action taken by the Subscriber from any trade idea or signal posted on the website(s) distributed through any form of social-media, email, the website, and/or any other electronic, written, verbal, or future form of communication . All analysis, trading signals, trading recommendations, all charts, communicated interpretations of the wave counts, and all content from any media form produced by www.Elliottwave-forecast.com and/or the Representatives are solely the opinions and best efforts of the respective author(s). In general Forex instruments are highly leveraged, and traders can lose some or all of their initial margin funds. All content provided by www.Elliottwave-forecast.com is expressed in good faith and is intended to help Subscribers succeed in the marketplace, but it is never guaranteed. There is no “holy grail” to trading or forecasting the market and we are wrong sometimes like everyone else. Please understand and accept the risk involved when making any trading and/or investment decision. UNDERSTAND that all the content we provide is protected through copyright of EME PROCESSING AND CONSULTING, LLC. It is illegal to disseminate in any form of communication any part or all of our proprietary information without specific authorization. UNDERSTAND that you also agree to not allow persons that are not PAID SUBSCRIBERS to view any of the content not released publicly. IF YOU ARE FOUND TO BE IN VIOLATION OF THESE RESTRICTIONS you or your firm (as the Subscriber) will be charged fully with no discount for one year subscription to our Premium Plus Plan at $1,799.88 for EACH person or firm who received any of our content illegally through the respected intermediary’s (Subscriber in violation of terms) channel(s) of communication.

Recommended content


Recommended content

Editors’ Picks

EUR/USD edges lower toward 1.0700 post-US PCE

EUR/USD edges lower toward 1.0700 post-US PCE

EUR/USD stays under modest bearish pressure but manages to hold above 1.0700 in the American session on Friday. The US Dollar (USD) gathers strength against its rivals after the stronger-than-forecast PCE inflation data, not allowing the pair to gain traction.

EUR/USD News

GBP/USD retreats to 1.2500 on renewed USD strength

GBP/USD retreats to 1.2500 on renewed USD strength

GBP/USD lost its traction and turned negative on the day near 1.2500. Following the stronger-than-expected PCE inflation readings from the US, the USD stays resilient and makes it difficult for the pair to gather recovery momentum.

GBP/USD News

Gold struggles to hold above $2,350 following US inflation

Gold struggles to hold above $2,350 following US inflation

Gold turned south and declined toward $2,340, erasing a large portion of its daily gains, as the USD benefited from PCE inflation data. The benchmark 10-year US yield, however, stays in negative territory and helps XAU/USD limit its losses. 

Gold News

Bitcoin Weekly Forecast: BTC’s next breakout could propel it to $80,000 Premium

Bitcoin Weekly Forecast: BTC’s next breakout could propel it to $80,000

Bitcoin’s recent price consolidation could be nearing its end as technical indicators and on-chain metrics suggest a potential upward breakout. However, this move would not be straightforward and could punish impatient investors. 

Read more

Week ahead – Hawkish risk as Fed and NFP on tap, Eurozone data eyed too

Week ahead – Hawkish risk as Fed and NFP on tap, Eurozone data eyed too

Fed meets on Wednesday as US inflation stays elevated. Will Friday’s jobs report bring relief or more angst for the markets? Eurozone flash GDP and CPI numbers in focus for the Euro.

Read more

Forex MAJORS

Cryptocurrencies

Signatures