|

Bloom Energy (BE) favors bounce towards $120.2 before lower

Bloom Energy Corporation., (BE) designs, manufactures, sells & install solid-oxide fuel cell systems for on-site power generation in the United States & globally. It offers Bloom Energy Server, a power generation platform to convert different fuels like Natural gas, Biogas, Hydrogen or blended fuel into electricity through electrochemical process. It comes under Industrials sector & trades at “BE” ticker at NYSE.

BE is bullish impulse in weekly sequence. It ended wave I at $147.86 high started from February-2024 low. It favors correction in II in 7 or 11 swings. We like to buy the clear pullback in 7 or 11 swings pullback at extreme area.

In weekly, it made all time low of $2.44 in October-2019. It placed (I) at $44.95 high of February-2021 & (II) at $8.41 low of February-2024. Above there, it ended I of (III) at $147.86 high in 11.10.2025 high & favors corrective pullback in II. It placed ((1)) of I at $29.82 high, ((2)) at $15.15 low, ((3)) at $125.75 high, ((4)) at $88.23 low & finally ((5)) at $147.86 high. Within ((1)), it placed (1) at $18.14 high, (2) at $9.02 low, (3) at $28.70 high, (4) at $21.57 low & (5) at $29.82 high. Within extended ((3)), it ended (1) at $29.44 high, (2) at $24.04 low, (3) at $86.89 high, (4) at $61.37 low & (5) at $125.75 high. It ended I of (III) in 11.10.2025 high & now favors pullback in II in proposed double correction.

BE – Elliott Wave latest daily view

Chart

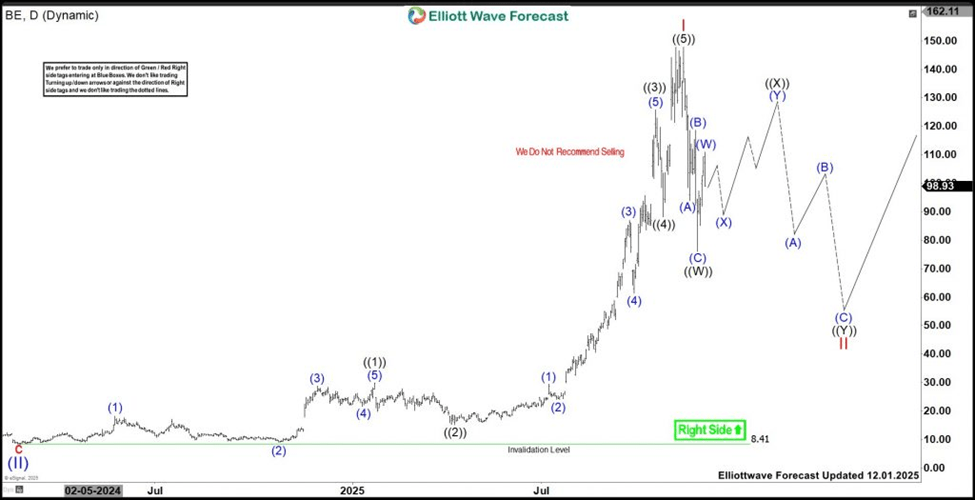
Below I high, it placed ((W)) at $76 low in 3 swings move & favors bounce in ((X)). Within ((W)), it ended (A) at $93.87 low, (B) at $118.58 high & (C) at $76 low. Currently, it appears ended (W) of ((X)) as 3 swings at $110.84 high & favors pullback in (X) against 11.21.2025 low. Above 11.21.2025 low, it expects another leg higher towards 120.2 or higher to correct against 11.10.2025 high to end ((X)). Later, it should turn lower in ((Y)) of II. Once it ends ((X)), we can project extreme area for ((Y)). We like to buy the pullback in extreme area in ((Y)) for wave III of (III).

Author

Elliott Wave Forecast Team

Elliott Wave Forecast Team

ElliottWave-Forecast.com

More from Elliott Wave Forecast Team
Share:

Editor's Picks

EUR/USD gains ground above 1.1800 ahead of Eurozone HICP release

The EUR/USD pair trades on a firmer note near 1.1830 during the early European session on Wednesday. Nonetheless, the upside for the major pair might be limited as traders remain cautious after a partial government shutdown swiftly ended. Later on Wednesday, the preliminary reading of the Harmonized Index of Consumer Prices from the Eurozone will be closely watched. 

GBP/USD steadies above 1.3700 near nine-day EMA support

GBP/USD steadies after registering modest gains in the previous session, trading around 1.3700 during the Asian hours on Wednesday. The technical analysis of the daily chart points to a potential bearish reversal as the range narrows, indicating waning buyer momentum within a rising wedge pattern.

Gold rallies further beyond $5,050 amid flight to safety, dovish Fed expectations

Gold attracts follow-through buying for the second consecutive day and surges past the $5,000 psychological mark during the Asian session on Wednesday amid the global flight to safety. Concerns over rising tensions between the US and Iran resurfaced following overnight reports that the US shot down an Iranian drone in the Arabian Sea. 

Bitcoin, Ethereum and Ripple extend free fall amid broad market sell-off

Bitcoin, Ethereum, and Ripple remain under pressure so far this week amid the broader market sell-off. BTC reached its lowest level since early November 2024 at $72,945. ETH and XRP, following BTC's lead, extended their losses, with ETH hitting a seven-month low while XRP also slid amid sustained selling pressure.

Gold and silver recovery continues, but equities sink as tech is shunned

The risk recovery is on pause as we move through Tuesday. After signs that a recovery in precious metals could boost overall risk appetite earlier today, a nasty sell off in tech stocks has pushed the Nasdaq and the S&P 500 down by 1.7% and 1.1% respectively.

Solana Price Forecast: SOL drops below $100 as bears tighten grip

Solana (SOL) trades below $100 at press time on Wednesday, after taking a more than 6% hit the previous day as the broader cryptocurrency market slipped. Institutional and retail demand for Solana continues to decline, while on-chain data shows a record 150 million daily transactions on Tuesday.