BLDR Elliott Wave bullish structure points toward new all-time highs

Wave (II) looks complete, right-side remains bullish, and wave (III) targets higher prices ahead
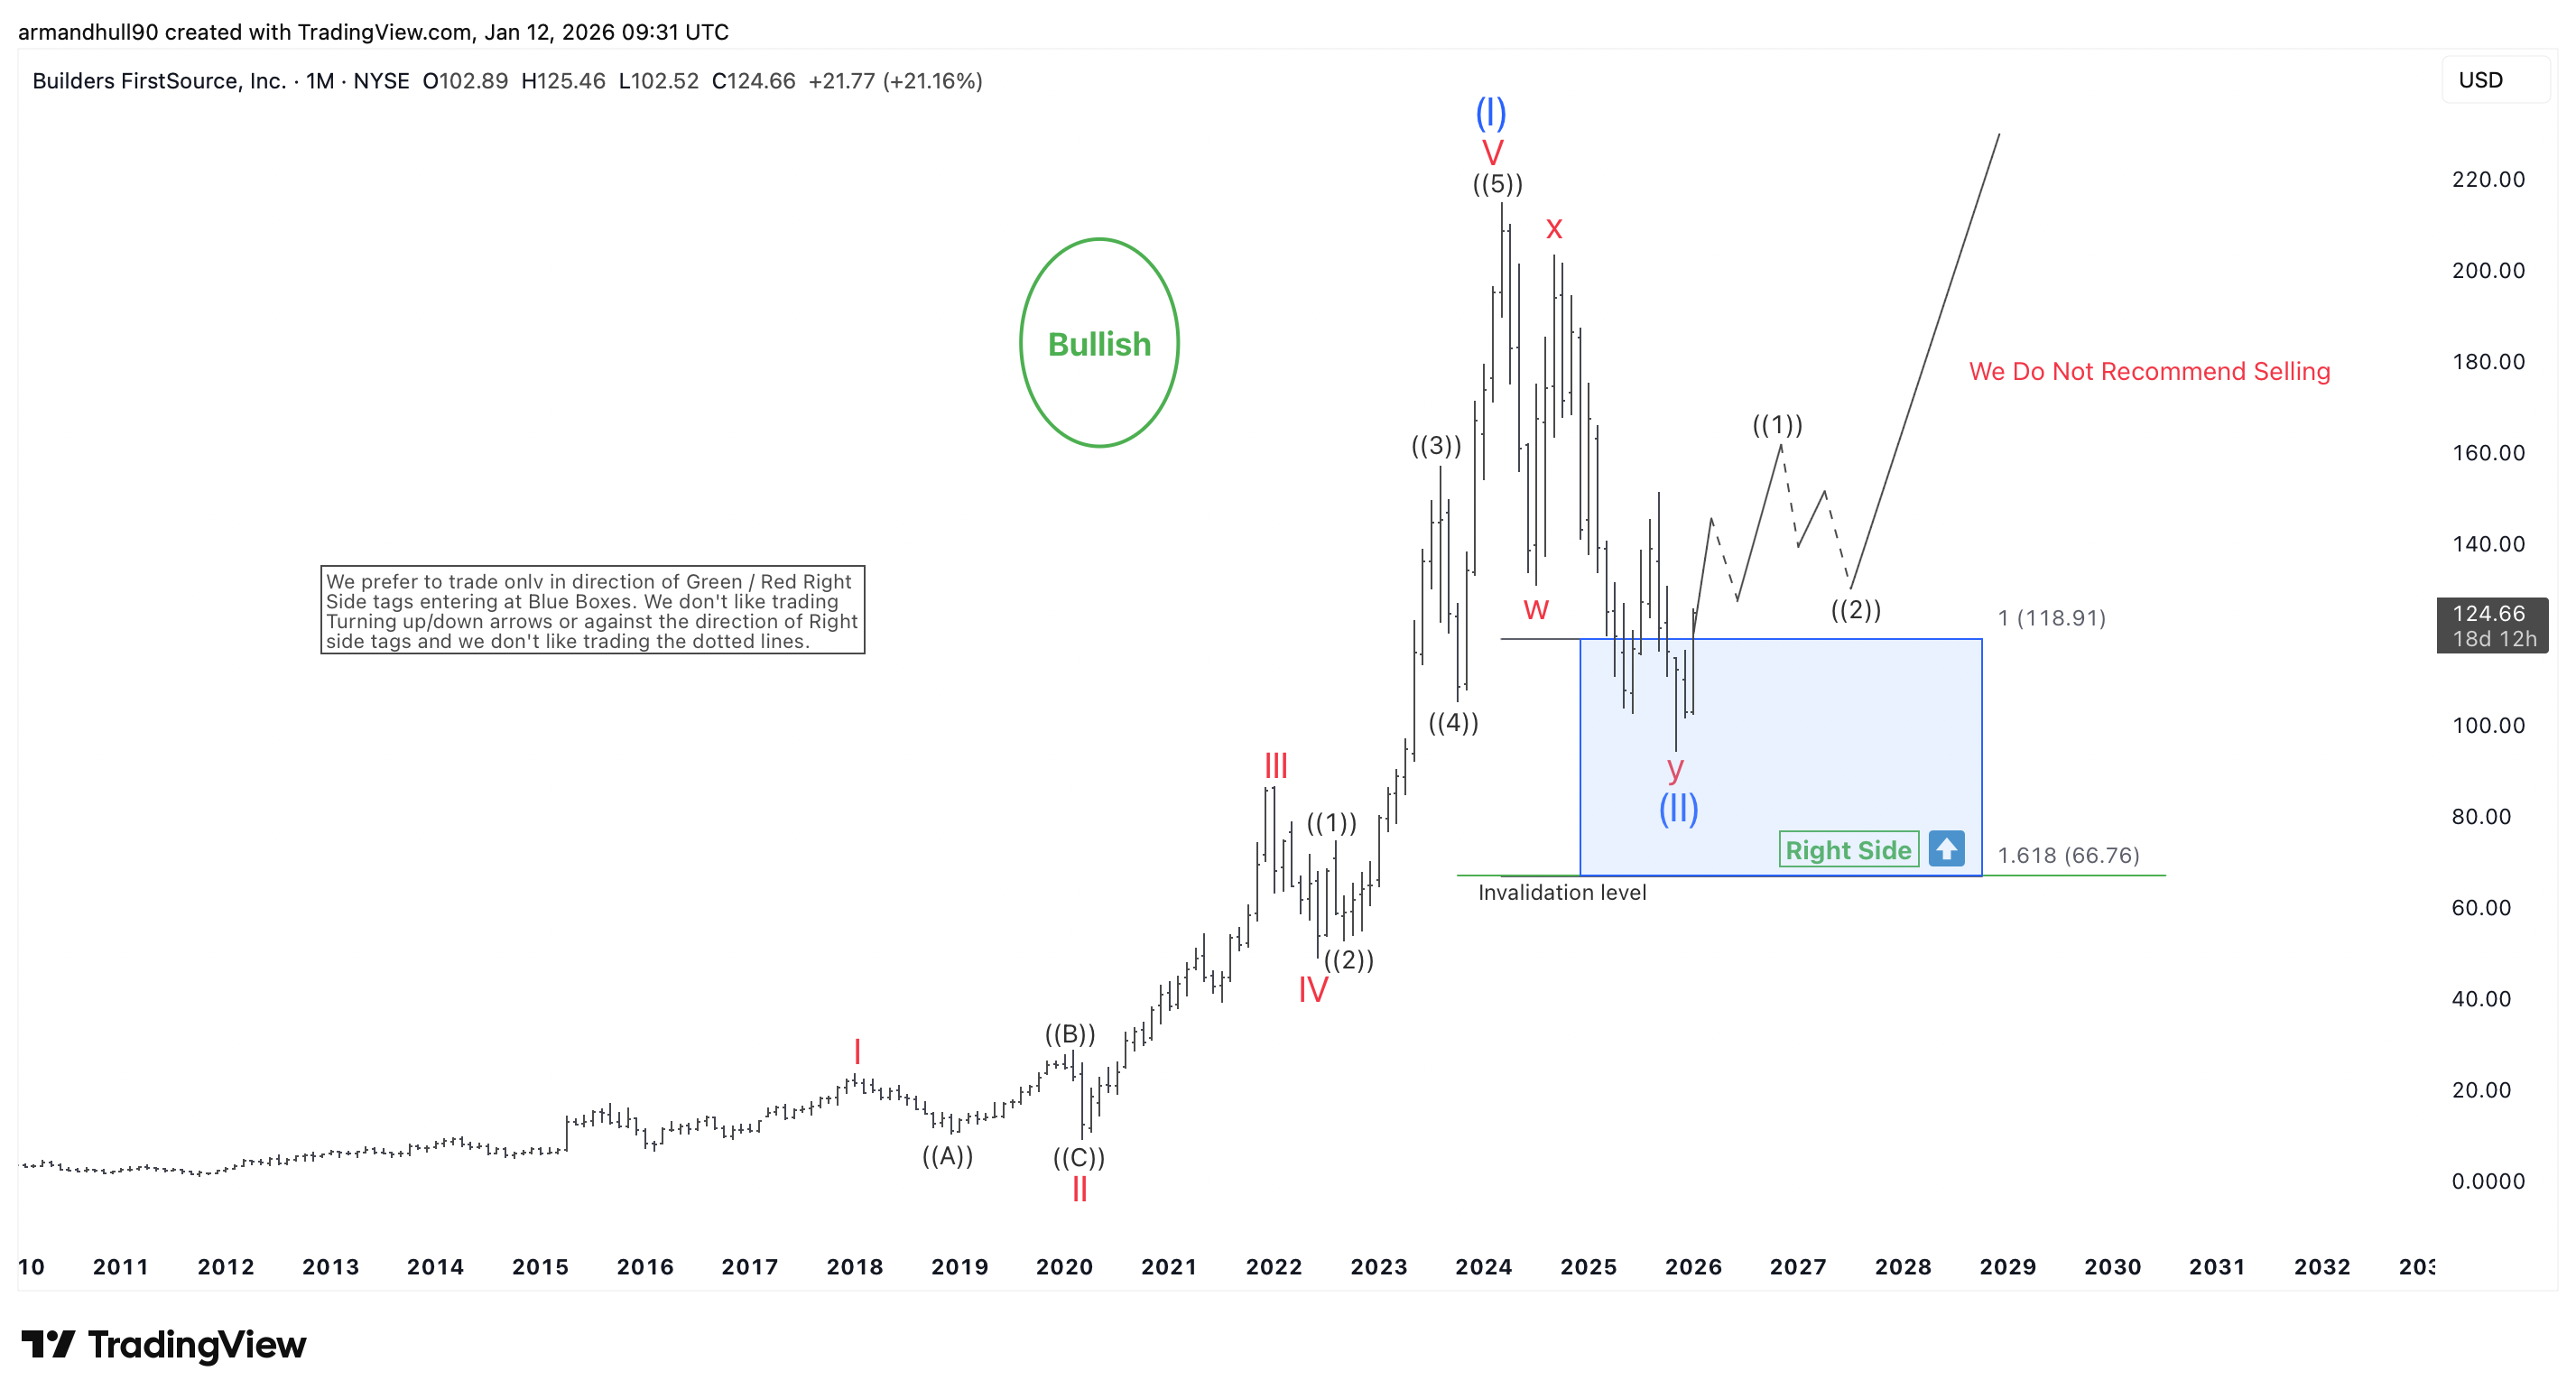
Builders FirstSource (NYSE: BLDR) continues to show a strong bullish outlook based on Elliott Wave Theory. The monthly chart highlights an impressive impulsive advance into the peak of wave (I). After that strong rally, the stock entered a larger corrective phase. This correction formed a W-X-Y structure and likely completed wave (II) inside the blue box support area.
Wave (II) correction likely completed – Bullish right side remains intact
During the correction, price tested key Fibonacci areas near 118.91 and the deeper 66.76 level. This zone created a major support region and helped the market stabilize. The Right Side tag still favors the bullish direction. The invalidation level remains far below, so the bullish structure stays valid as long as price holds above support.
After stabilizing inside the blue box, BLDR started to turn higher. This move suggests that wave ((1)) of a new bullish cycle may have already begun. A small pullback in wave ((2)) can still happen, but as long as it remains corrective, the stock should continue higher again.
Upside targets and long-term bullish expectation
With wave (II) potentially completed, BLDR is positioned to begin a powerful impulsive advance in wave (III). Historically, third waves tend to be the strongest and longest within Elliott Wave structures, often breaking previous highs and establishing new records. Therefore, the next bullish phase is expected to challenge recent highs and then push toward new all-time highs, supported by strong momentum and positive cycle alignment.
We do not recommend selling the stock as the long-term trend remains bullish. As long as the structure holds above the invalidation level and price continues respecting the bullish sequence, buyers are expected to remain in control.
Summary
In summary, Builders FirstSource maintains a strong bullish Elliott Wave structure, showing that wave (II) is likely in place and the market is preparing for a powerful advance in wave (III). Investors and traders who follow long-term structural trends may continue to favor the upside, anticipating new all-time highs in the coming cycles.
Author

Elliott Wave Forecast Team
ElliottWave-Forecast.com


